Following futures positions of non-commercials are as of December 6, 2016.
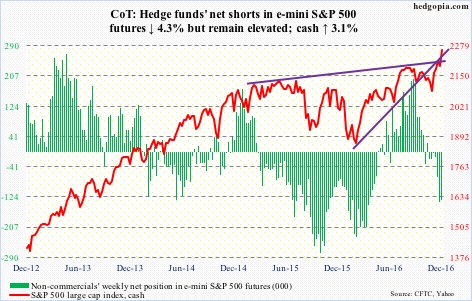
E-mini S&P 500: Yet another week, and yet another all-time high. The Trump rally marches on. Wednesday’s 1.3-percent jump took out the previous high 2214.1 of five sessions ago. Bulls would now be looking to defend this the next time the cash weakens. In the last two sessions last week, they were able to defend three-month support at 2190-ish.
There is giddiness in the air.
Both the Dow Industrials and Transports rallied to new all-time highs. For proponents of the Dow Theory, this is a buy signal. Whatever that means. On a trailing 12-month basis, the S&P 500 is trading at north of 21x – so let us not even talk about valuation support.
That said, momentum is intact, and the crowd has decided the U.S. election has changed the risk-reward dynamics. In the latest week, Investors Intelligence bulls were 58.8 percent – the highest since February last year. The NAAIM (National Association of Active Investment Managers) exposure index was at 101.6. The chips have been pushed to the middle of the table. All good so long as another party is willing to pay a higher price (the greater fool theory).
The risk in all this is that nouveau investors will be left holding the bag when the music stocks. Traders tend to be flexible and hopefully will dodge the bullet.
In the week ended Wednesday, $4.5 billion moved into SPY, the SPDR S&P 500 ETF. In the prior couple of weeks, $3.4 billion was redeemed (courtesy of ETF.com).
Also in the week through Wednesday, $2 billion came out of U.S.-based equity funds (courtesy of Lipper).
Currently net short 133.3k, down 6k.
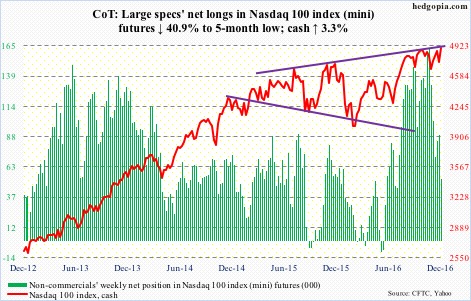
Nasdaq 100 index (mini): The saga continues. Even as the S&P 500, Russell 2000 and Nasdaq composite rallied to fresh highs this week and a Dow Theory buy signal was flashed, the Nasdaq 100 refuses to join the party. Sort of. It still has not posted a new high. The last one was on October 25 (4911.76).
That said, it did rally 3.3 percent this week – past its 50-day moving average, and past resistance at 4840.
The problem continues to be flows. In the week ended Wednesday, QQQ, the PowerShares Nasdaq 100 ETF, lost $2.6 billion (courtesy of ETF.com). Since Mr. Trump was elected president, $885 million has been redeemed.
Currently net long 52.7k, down 36.5k.
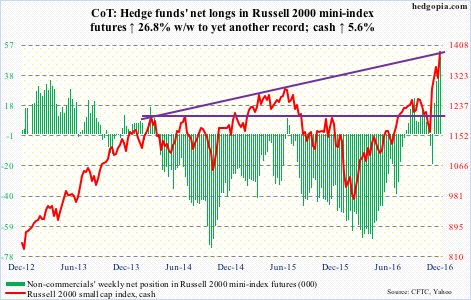
Russell 2000 mini-index: From post-Thanksgiving Friday to Thursday last week, the cash declined 2.8 percent. Turns out that was a pause to refresh. From that low, it then rallied six-plus percent. Wednesday’s low successfully tested the post-Thanksgiving high. In other words, buyers are showing up where they are supposed to – technically speaking.
It has all come down to technicals right now. In a late-cycle economy, there is no fundamental basis for an index to surge 20 percent in a month – north of 16 percent post-Trump win – which is what the Russell 2000 has done.
On this basis, as overbought as the cash is, momentum is yet to break, although flows are beginning to weaken.
In the week ended Wednesday, IWM, the iShares Russell 2000 ETF, lost $327 million. This came on the heels of inflows of $5.3 billion in the prior three (courtesy of ETF.com).
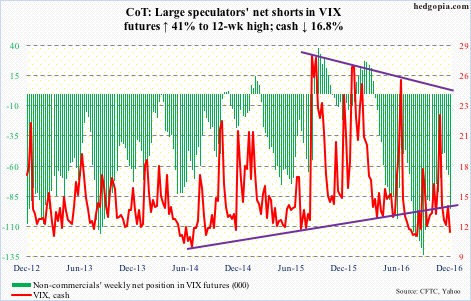
That said, non-commercials accumulated net longs to yet another record. Plus, IWM short interest jumped 6.2 percent in the November 16-30 period to a 14-month high, and they probably got squeezed.
Currently net long 49.4k, up 10.4k.
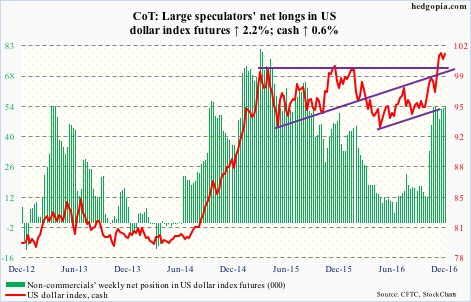
US Dollar Index: Dollar bulls obviously expended lots of energy in rallying the cash past 100. Since May this year, it jumped 11 percent, and in the process has priced in a lot – from stronger economic growth to higher interest rates.
This has pushed weekly momentum indicators into gross overbought zone. All along, non-commercials never seriously jumped on the rally bandwagon.
In the right circumstances, there is a lot of unwinding left in the cash. Near-term, it is itching to have another go at the November 25 high of 101.97.
Currently net long 54.6k, up 1.2k.
VIX: Intra-day Wednesday, the cash dropped to 11.33. This was the second straight sub-12 reading. But by close, it rallied to 12.22, up 3.7 percent. The S&P 500 jumped 1.3 percent in that session. Quite a divergence. This was also a session in which the CBOE put-to-call ratio dropped to a complacent 0.46, matching the low of June last year.
Thursday saw the same phenomenon, with the spot dropping to 11.3 intra-day but closing up 3.4 percent to 12.64, the S&P 500 rallying 0.2 percent and the P2C ratio at 0.5. Come Friday, VIX dropped seven percent to close at 11.75, with the P2C ratio at 0.53.
At Wednesday’s lows, the VIX-to-VXV ratio dropped to 0.75, before rising a tad. By the end of the week, it stood at 0.77 – well into oversold territory, and a fourth straight week in that zone.
 News
News  Market Data
  Discover