Buy:sell, daily shorts & pps 11/18 2016 EOD
Today looked a bit more like I would expect when "the market" is disinterested and the MMs are not short-term long. Since yesterday offered fewer attractive covering buy points (see the mountain chart in yesterday's post), I think this fits with my comments about the recent apparent strength being nothing but manufactured vapor ("smoke & mirrors" is so trite now) that would dissipate in a day or two.
Dissipation completed? With the close back down to the 11/11 close when this faux run up began, I suspect so.
In contrast to the last few days, if we stick our head up out of the weeds just a wee bit we would call today flattish after the first 33 minutes' typical open high and drop to the day's low, hitting $0.901. Then came a flattish period, 9:34-11:20ish, an extremely low/no-volume mostly $0.9100/98, punctuated with a couple volume spikes and a couple lower prices. The trade moved up a wee bit, all on extremely low/no-volume of course, to hit $0.9318 at 11,34, dropped back into the former range by 11:47, did 12:07's 21.1K $0.91/$0.95 (YAY! Everybody start piling in - it's going to run on you! ... NOT!), came right back down to the prior range again and stayed there through 12:18. The trade popped up to as high as $0.936x by 12:21, stayed there a few minutes and dropped back down to the former range around 12:45. The rest of the day was flattish $0.91xx/$0.92xx, but for 13:23's 22.1K $0.9125/$0.94, and weakening into the close.
The close was interesting, but not atypical. Last 15:59 trades were $0.91xx and closed at $0.9101 but 16:00 was an 8.8K $0.9333. In the same minute 300 more did $0.91 (MM set-up for Monday?).
There were no pre-market trades.
09:30-10:04 opened the day with a 10,606 buy for $0.9580 and 1,382 more at that price. Then came 9:30's b/a 1K:600 $0.91/$0.9599, 9:33's b/a 1.5K:700 $0.91/$0.9598, 9:32's 363 $0.9201->$0.9596, 9:34's 800 $0.9587, 9:35's 150 $0.9312, 9:37's 3.8K $0.9205/19->$0.9215->$0.91->$0.9202, 9:38's 200 $0.9598, 9:39's b/a 1.7K:1.3K $0.91/5, 9:42's 100 $0.91, 9:44's b/a 1.9K:100 $0.91/$0.9499, 9:47's b/a 1.1K:400 $0.91/3, 9:48's 200 $0.91, 9:49's b/a 900:200 $0.91/$0.9270, 9:51's 200 $0.9270, 9:58's b/a 1K:300 $0.91/$0.9273, 9:59's 100 $0.926, 10:02's 100 $0.91, 10:03's 1.4K $0.9110/03/00/$0.9260/$0.9187/$0.9260/06/60, and the period ended on 10:04's 2.6K $0.9100/10/$0.9273/60/73/60/00.
10:05-11:15 saw 10:05's b/a 700:600 $0.9010/$0.92 and, after four no-trades minutes, began very low/no-volume $0.9012/$0.9198 on 10:09's 2.2K $0.92/$0.9105/$0.92, saw 10:11's b/a 100:400 $0.9050/$0.92, 10:21's b/a 700:100 $0.9012/$0.9198, 10:36's b/a 800:700 $0.9012/$0.9198. The high dropped to $0.9147 at 10:54. B/a at 10:58 was 1.7K:1K $0.9100/94. The period ended on 11:15's 1.6K $0.9124/5.
11:16-11:48 saw b/a at 11:20 of 100:500 $0.92/$0.9350 and after six no-trades minutes began an extremely low/no-volume weak move up from 11:21's 1K $0.9222, seeing 11:23's 100 $0.9296, 11:25's b/a 100:200 $0.9260/$0.9333, 11:27's 2.1K $0.9201/99, 11:30's 300 $0.9299/$0.9307, 11:34's 200 $0.9318, and then extremely low/no-volume $0.9130/$0.9318 with sinking highs. The period ended on 11:48's 100 $0.9131.
11:49-12:06, after six no-trades minutes, began mostly verylow-volume on 11:54's 10.1K $0.9112. Volume was interrupted by 11:54's 10.1K $0.9112. B/a at 11:58 through period end was polluted by the bots shuffling the offer lower and lower while bid held steady @ 2K $0.91. The period ended on 12:06's 210 $0.91.
12:07-12:07 stopped the bots playing with the offers by buying up everything in sight on 21.1K $0.9103/41/98/$0.9280/$0.9300/13/50/$0.9400->$0.9350->$0.95->$0.91->$0.9197.
12:08-12:20 began a mixed-volume $0.9120/98 on 12:08's 1.4K $0.913. The period ended on 12:20's 100 $0.9179.
12:21-12:41 began extremely low/no-volume $0.9230/69 on 12:21's 8.6K $0.9179/80/88/98/99/$0.9200. 12:21 b/a at 12:28 was 300:300 $0.9229/$0.9369, 12:34 300:300 $0.9229/$0.9369. The period ended on 12:41's 500 $0.9349/69.
12:42-13:20, after one no-trades minute, began extremely low/no-volume $0.9125/$0.9197 (with high quickly sagging to $0.913x). The period ended on 13:20's 1.4K $0.9127/$0.913.
13:21-13:23, after two no-trades minutes, did 13:23's 22.1K $0.9126/9/$0.9132/5/6/7->$0.92/3/$0.9300/50/$0.9125.
13:24-14:35, after five no-trades minutes, began extremely low/no-volume $0.9127/$0.9254 with falling highs, hitting $0.9250 at 13:39, $0.9246 at 14:06, $0.9177 at 14:15, $0.9128 at 14:16. B/a at 14:22 was 500:500 $0.9126/9. The period ended on 14:35's 600 $0.9128.
14:36-15:49, after one no-trades minute, tried but failed, to do a little bump up and maintain it on 14:37's 100 $0.9148. B/a at 14:54 was 100:300 $0.9151/67. After almost no trades through 14:58 the range began an extremely low/no-volume sag and went to $0.9100/0x by 15:04. B/a at 15:11 was 1K:100 $0.91/18, b/a at 15:19 200:100 $0.9100/21, 15:26 300:200 $0.9100/17. Range was $0.9100/2x at 15:32. B/a at 15:34 was 2.7K:200 $0.9100/21. The period ended on 15:49's 200 $0.9101.
15:50-16:00 began mostly very low/no-volume EOD volatility (if we can call it that) $0.9100/90 on 15:50's $0.9100/90. B/a at 15:53 was 100:1K $0.918500/90. The day and period ended on 15:59's 2.9K $0.9000/1 and 16:00's closing trade of 8,809 $0.9333 (a nice bump from 15:59's closing $0.91, no?) and 300 buy for $0.91.
There was one AH buy of 146 for $0.919.
Including the opening and closing trades, there were 7 larger trades (>=5K & 1 4K+) totaling 61,842, 31.68% of day's volume, with a $0.9364 VWAP. Excluding the opening trade, there were 5 larger trades totaling 42,427, 21.74% of day's volume, with a $0.9317 VWAP. The counts of larger trades, for today's trade volume, is more or less in-line with ~195K traded. With both the opening and closing trades hitting sizes normally seen only in "the old days", when trade volume was generally much higher, the percentage including the opening and closing trades is very high. Excluding them puts the percentage into what I think is normal for the trade volume. Yesterday the percentage was very low. Ending Period Period Period __Per. Trade_ Period_ % Day_ Per. End
Period Volume Low High _Dollar Val._ VWAP___ Volume Buy ~%
10:04 22102 $0.9010 $0.9598 $20,800.74 $0.9411 11.32% 66.41% Incl 09:30 $0.9580 10,606
11:15 11313 $0.9012 $0.9200 $10,344.79 $0.9144 5.80% 70.83%
11:48 6240 $0.9130 $0.9318 $5,753.16 $0.9220 3.20% 63.25%
12:06 11000 $0.9100 $0.9123 $10,023.06 $0.9112 5.64% 49.94% Incl 11:54 $0.9112 10,000
12:07 21100 $0.9100 $0.9500 $19,856.76 $0.9411 10.81% 60.72% Incl 12:07 $0.9500 14,700
12:20 17574 $0.9120 $0.9198 $16,104.07 $0.9164 9.00% 59.76%
12:41 12256 $0.9179 $0.9369 $11,325.91 $0.9241 6.28% 59.51%
13:20 12650 $0.9125 $0.9229 $11,604.92 $0.9174 6.48% 55.58%
13:23 22106 $0.9125 $0.9400 $20,577.18 $0.9308 11.33% 61.94% Incl 13:23 $0.9200 6,800 $0.9400 6,927
14:35 13104 $0.9125 $0.9276 $12,040.39 $0.9188 6.71% 62.14% Incl 14:04 $0.9211 4,000
15:49 21546 $0.9100 $0.9199 $19,648.92 $0.9120 11.04% 61.66%
16:00 21803 $0.9100 $0.9333 $20,091.92 $0.9215 11.17% 61.92% Incl 16:00 $0.9333 8,809
18:56 146 $0.9190 $0.9190 $134.17 $0.9190 0.07% 61.95%
You can see the typical rise in the first period (compared to yesterday's ending $0.9358 VWAP) followed by the common general weakening with "blips" in very short periods as the beneficiaries of the manipulation take advantage. Note the last real sign of strength was the 12:07 period, one minute that was ~11% of day's volume - ~36.7% from the day's start to then.
Note how quickly VWAP dropped subsequently and any attempt to move higher was pretty much stifled. When you look at the buy percentages you'll note we were well above 50% all day before and after 12:06's end. Even removing the opening trade, after the opening trade is diluted out by volume the day's buy percentage ended only about 200 basis point lower (16:00 would be ~59.6x% buys).
This suggests that, generally, offers were dropping and buys were coming on the lowered offers - a sign of selling strength as apparently folks try to exit their positions. I believe for normal traders and investors this happens only when they feel the stock is overvalued (investors?) or has peaked (traders?).
Between the two of them, one should ask who was buying?
Another possibility would be MMs driving market up as they (previously?) found attractive covering prices for their short positions or had in-hand a larger order for shares at a higher price. The intermittent prices spikes higher may have put the MMs in a position to make the following prices attractive covering price points (barely I think) but it's also possible that yesterdays large-volume volatility with moves as high as $0.98 and lows as low as $0.9010 put them in near-term long position, regardless of my thought above that yesterday appeared to not offer that many attractive buy points. This would be a good reason to move the market higher and hold it there until they sold their shares to momo or day traders or maybe shorters doing covering buys or even other MMs. If the shorters were fearful I could see this but I can't believe they don't recognize what I think I recognize - unchanged fundamentals, nearing 30 days below $1 bringing de-listing warning nearer, price being manipulated higher (trying to avoid de-listing risk or maybe warrant holders trying to get "in the money" before the notice is issued?).
Regardless, this recent run has been certainly abnormal, out of character for a market having lost all confidence in the company pronouncements and the ability to execute what was laid out. It's also contrary to the recent short interest increases' indications of what should be happening right now, and ...
Most importantly, to me, the displayed intra-day behavior is totally out of character for all of the normal market's behavior for this stock and the above considerations.
However, I could be "behind the times". This may be "The New Normal".
On the traditional TA front, movements were: __Open_ ___Low_ __High_ _Close_ Volume_
Today 5.27% 0.11% -2.16% 2.22% -51.39%
Prior -0.58% 2.82% 3.16% -1.29% 101.82%
As is so often the case recently, these improved readings occur on falling, and today low, volume, telling us there's no strength in the move up. However, as always we have to be cognizant that this may a "Friday effect", which often has lower volume. But this is most often accompanied by predominately flattish intra-day behavior within a range not too far from the prior day's. Today was flattish only regarding the low throughout most of the day. The highs were more volatile until the final longer decline began after 13:30.
On my minimal chart, the important note is that trading began above the rising triangle's (orange lines at lower right on chart), quickly moved below it and closed below it. It also closed below the rising support but I determined that adjustment was warranted. The line now originates at the low of 11/3 ($0.75) and has touches at the lows of 11/4, 11/16 and 11/18. With this adjusted line the close was above that rising support. Regardless of future action, this line does not get adjust again as an origin and two more touches validates a support/resistance and we have three.
This adjustment puts the trading back to the left of the apex, but still in the range where a break normally becomes likely.
Keep in mind that triangle is very-short-term.
If we break below that rising line the next support down becomes $0.75, using the low of the recent leg down, and $0.87/8 assuming a reversion to the mean from $0.75 up to $0.9799, the recent leg up and consolidation's high.
The experimental 13-period Bollinger limits both continue the recently begun rise and are moving sort of parallel, raising the mid-point.
After three days of the fast and slow close-based EMAs being essentially flat and at the same level, we now have the second consecutive day of a declining fast EMA, as I mentioned yesterday, not a good sign. The slow EMA is also declining, which it began doing 11/10.
All this, rising Bollinger limit's not withstanding, continues to lead me to "consolidation with a bearish bias", as stated yesterday.
On my one-year chart, the 10-day SMA continued to rise for the fourth day while the remaining SMAs continued falling. If we remain at this level, the 10-day will continue rising for still at least three days, the 20-day will fall six (again) more days, and the 50-day would continue falling another 35 days or so.
Yesterday the oscillators I watch had improvement only in MFI (untrusted by me). All others weakened. All but accumulation/distribution and ADX-related were still above neutral.
Today we had improvement in RSI, MFI (untrusted by me), Williams %R, and accumulation/distribution (marginally). ADX-related was weaker or flat, depending on how you choose to view the individual components (I go weaker). Weakening was seen in everything else. All but RSI, accumulation/distribution and ADX-related are above neutral.
The experimental 13-period Bollinger limits, $0.7733 and $0.9958 ($0.7658 and $0.9903 yesterday) are rising and the limits are pretty-much parallel.
All in, the declining EMAs, the move back below the triangle's horizontal support/resistance with a bottom right on its newly-constructed rising support, and the lack of a positive trend getting establish in the oscillators I watch offset any positives suggested by the rising 10-day SMA and mixed oscillators. The falling, and low, volume on an ostensibly "up" day also offset the positives. So, here it comes again ...
This all suggests to me, at best, a continued consolidation with a mild bearish bias, but now with more emphasis on the bearish potential.
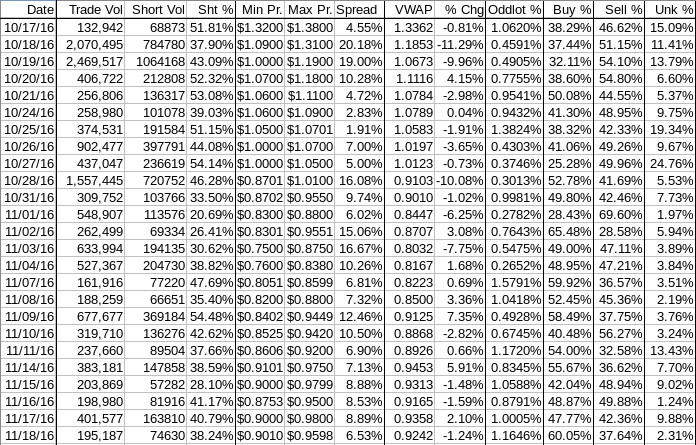
Percentages for daily short sales and buys moved in opposite directions, recently normal but longer-term abnormal and not good. The good is that the short percentage moved from the middle to the low end of my desired range (needs re-check), which is good. The buy percentage, after spending three days in area were up is possible but not sustainable, moved to an area that would suggest sustainability if it was a trend, but it's not a trend. The trend is that these readings suggesting sustainable appreciation always fall quickly back to the levels (at best) where appreciation is possible but not sustainable. Check the table for what happens to buy percentage and VWAPs and short percentages before the obvious manipulation began, ~11/14, and even then it's had a tough slog.
The spread remains too wide and today was produced by a very high open and a very big drop and inability to recover much of the drop but for a few one-minute volume and price spikes. Given the general weakening trend seen in the VWAPs I think this is telling us more near-term weakness is the most likely behavior.
The VWAP's last twenty-four readings held, for the fourth day, at 14 negatives and 10 positives. Change since 10/17 is -$0.4120, -30.83%, and the averages of the rolling 24-day period seen in the last few days (latest first) are now -1.4049%, -1.3868%, -1.4232%, -1.3956%, -1.4743%, -1.7433%, -1.8222%, -1.7635%, -1.8877%, and -1.8884%.
All in, the continued inconsistency among the various metrics and inability to establish a somewhat consistent trend in VWAP change and buy and short percentage combined with low volume and a spread too wide and produced as it was leaves me still thinking consolidation with a mild bearish bias at best. Having watched the intra-day I think bearish is likely to become more pronounced.
Bill
 News
News  Market Data
  Discover


