Buy:sell, daily shorts & pps 11/14 2016 EOD
Everything is coming up roses today and only my concern that the short-term resistance was penetrated, courtesy of the appearance of the left coasties after an initially typical weakness in buy percentage, combined with the volume spiking pretty good and my TFH belief that the shorters will be concerned about their plans being thwarted gives me concern.
I expect they will attack price shortly to make sure we don't get past $1. Could start as soon as tomorrow.
There was a nice PR for a C1000S Order with Integrated Heat Recovery Modules for Leading New York Food Retailer.
Ignoring my TFH, today it looks like the market actually responded positively for a change instead of tanking the stock.
We didn't see the too-common tanking of the price on a positive PR, nor did we see any of the common early-day shenanigans of open high/low, go up/down, reverse and lose/recover a goodly portion of the move, go flattish with minor bumps up.down until EOD push one way or the other occurs.
Rather, it was a nice day of soothing waves consisting of small drops, larger rises, and short flattish periods. Quite calming compared to what we usually experience.
There were no pre-market trades.
B/a at 9:00 was 3.6K:1K $0.87/$0.9551, 9:27 200:1K $0.8702/$0.9549, just before open 100:1K $0.8702/$0.9549.
09:30-10:18 opened the day with a 10,537 buy for $0.9450. Then came 9:33's b/a of 1.9K:8.7K $0.91/$0.9450, 9:34's 1K $0.92, 9:35's 9.1K $0.92->$0.9164 (5K)->$0.9135, 9:37's b/a 2.5K:9.5K $0.9104/$0.9450, 9:38's b/a 2.6K:900 $0.9104/$0.9250, 9:39's 200 $0.9105, 9:41's b/a 4.6K:700 $0.9104/$0.9250, 9:41's 2.4K $0.9405/4->$0.9141 (200), 9:43's b/a 4.5K:100 $0.9104/$0.9249, 9:48's b/a 2.8K:100 $0.9104/$0.9249. That began very low/no-volume $0.9107/$0.9221. B/a at 10:05 was 400:600 $0.9108/$0.9200. The period ended on 10:18's 850 $0.92->$0.9167->$0.9201.
10:19-10:36 began a rise on 10:19's 1.1K $0.9176->$0.9201/2->$0.9249. Then hit 10:20's 6.3K $0.925/0.94, 10:26's 2.3K $0.9400/50, 10:35's 1.5K $0.94->$0.9331->$0.9401->$0.94, and ended the period on 10:36's 500 $0.939/$0.9448.
10:37-10:56 began a low-volume sag on 10:38's 1.1K $0.9399/$0.9433. Then it hit 10:41's b/a of 100:2K $0.9380/$0.9446, 10:43's 1.3K $0.9204/$0.938, bounced right back up and declined again through 10:56's 200 $0.9204/47 to end the period.
10:57-11:18 began very low/no-volume $0.9226/50 on 10:57's 300 $0.9227/$0.925. B/a at 11:03 was 1.5K:600 $0.9204/$0.9247. The period ended on 11:18's 400 $0.9247.
11:19-11:31 began a very low/no-volume rise on 11:19-:20's 3.3K $0.9244/7->$0.9248/50->$0.9250/1->$0.9252. B/a at 11:20 was 1.2K:300 $0.9240/52, 11:21 1.1K:1K $0.9270/89. Trading hit 11:23's 300 $0.9289/$0.929, 11:28's 723 $0.9449 and began extremely low/no-volume $0.9386/93. The period ended on 11:31's 1K $0.9386/$0.9393.
11:32-12:52 began volatile volume and price, varying from $0.9104 to $0.939, on 11:41's 18.4K. Volume went extremely low/no-volume at 11:46 and lows began slowly rising. B/a at 11:50 was 800:1.2K $0.9121/$0.9197. 12:07's 9.5K narrowed range to $0.9201/$0.939. B/a at 12:11 was 1.1K:600 $0.9201/97, 12:27 1.1K:3.7K $0.9221/$0.9390, 12:33 700:3.5K $0.9221/$0.9390, 12:45 700:300 $0.9222/$0.9354. The period ended on 12:52's 300 $0.9348/9.
12:53-13:37 began with b/a of 12:53 1.4K:7.5K $0.9332/$0.9490. Range began stepping up on 12:53's ~1K $0.938/$0.94, hit 12:55's 10.7K $0.9400/50, 12:59's b/a of 300:7.7K $0.9449/50, 13:22's b/a 1K:2.9K $0.9449/50, 13:23's 12.3K $0.9449/$0.95, 13:24's 12.9K $0.9499/$0.9551, 13:25's b/a 2K:200 $0.9501/2, 13:33's 6.5K $0.9551/$0.96, 13:36's b/a 1.1K:2.4K $0.9599/$0.96, 13:37's 10.9K $0.9599/$0.975, and the period ended on 13:37's 10.9K $0.9599/$0.975.
13:38-14:17 began initially low-volume, some medium-volume $$0.9600/2 on 13:38's 900 $0.9711/$0.973. B/a at 13:49 was 200 400 $0.9589/99. 13:59 began variable-volume $0.9697/8 with declining highs and ended the period on 14:17's 200 $0.968.
14:18-14:58, after one no-trades minute, began mostly low/no-volume, and some medium-volume $0.9502/$0.9641 on 14:19's 5.9K $0.9600/63. B/a at 14:25 was 100:2.3K $0.9600/81. Price was interrupted by 14:34's 100 $0.9591. B/a at 14:38 was 2.2K:1K $0.9502/$0.96. Volume went extremely low at 14:40. The period ended on 14:58's 304 $0.9679.
14:59-15:31 began extremely low/no-volume $0.9502/51, with falling highs, on 14:59's 500 $0.9502/97. B/a at 15:05 was 2.2K:2.4K $0.9502/98. At 15:18 range was down to $0.9502/77. B/a at 15:20 was 2.1K:1.9K $0.9502/76, 15:25 1.9K:1.7K $0.9502/70. At 15:30 range was down to $0.9502/49. The period ended on 15:31's 100 $0.9523.
15:32-16:00 began a quick fall, followed by a medium-volume (rising to high volume at 15:43) recovery, on 15:32's 3.5K $0.9502->$0.9503->$0.945->$0.95. 15:33 did 1.6K $$0.9401-$0.94->$0.955->$0.943, 15:34 did 1.4K $0.943/7. 15:34 began the move back up. 15:39's b/a was 1.7K:200 $0.9498 (bots kept changing the offer), 15:41's 400 hit $0.9498/$0.9521, 15:43's 6.5K $0.95/6. Then a high-to-low-volume $0.9540/55 sideways move lasted through 15:54. 15:55 started a drop on the normal EOD volatility and the period and day ended on 15:59's 2.1K $0.9400/1->$0.9530->$0.9400/1->$0.9530->$0.9465->$0.9530->$0.9401/3->$0.96 and 16:00's 300 buy for $0.97.
There were no AH trades.
Including the opening trade (closing didn't qualify), there were 15 larger trades (>=5K & 4 4K+) totaling 101,924, 26.60% of day's volume, with a $0.9457 VWAP. Excluding the opening trade, there were 14 larger trades totaling 91,387, 23.85% of day's volume, with a $0.9458 VWAP. Counts and percentage of day's volume seem normal. Both VWAPs are higher than the day's $0.9453. But they are very close. Looking at the breakdown below we see that's a result of a substantial portion of the larger trades executing well before the last 1/3rd+ of the day's volume pushed the prices well above the very short-term resistance from the minimal chart. We had four "larger larger trades", which is not a high number but is a positive regardless. Ending Period Period Period __Per. Trade_ Period_ % Day_ Per. End
Period Volume Low High _Dollar Val._ VWAP___ Volume Buy ~%
10:18 31345 $0.9101 $0.9450 $29,043.36 $0.9266 8.18% 56.37% Incl 09:30 $0.9450 10,537 09:35 $0.9164 4,800
10:36 22425 $0.9176 $0.9450 $21,006.86 $0.9368 5.85% 48.82% Incl 10:32 $0.9400 5,000
10:56 8271 $0.9204 $0.9433 $7,726.85 $0.9342 2.16% 44.90%
11:18 5650 $0.9204 $0.9250 $5,217.20 $0.9234 1.47% 46.60%
11:31 7400 $0.9244 $0.9449 $6,926.09 $0.9360 1.93% 45.91%
12:52 58305 $0.9104 $0.9390 $53,732.03 $0.9216 15.22% 43.53% Incl 11:41 $0.9104 14,095 12:07 $0.9201 5,000
13:37 103413 $0.9380 $0.9750 $98,308.58 $0.9506 26.99% 59.41% Incl 12:59 $0.9450 10,000 13:09 $0.9450 7,142
13:33 $0.9600 4,000 13:34 $0.9600 5,000
13:37 $0.9750 6,750
14:17 51303 $0.9549 $0.9746 $49,445.82 $0.9638 13.39% 55.92% Incl 13:49 $0.9600 4,500 14:14 $0.9684 5,000
14:58 34050 $0.9502 $0.9683 $32,684.96 $0.9599 8.89% 54.25% Incl 14:29 $0.9641 4,600 14:39 $0.9644 5,500
15:31 7818 $0.9502 $0.9600 $7,469.94 $0.9555 2.04% 54.16%
16:00 50030 $0.9400 $0.9700 $47,659.89 $0.9526 13.06% 55.72% Incl 15:46 $0.9580 10,000
You can see the difference in today's behavior - no big drop in VWAP at all and only one big drop in buy percentage that occurred, predictably, after the early achievement of $0.94xx, our former expected resistance point. It would be the natural swing/momo/shorters response to this price level. But then, around the time the "left coasties" could be expected to arrive, buying strength appeared and maintained for the rest of the day.
I expect the following days will see the shorters attempt to push price lower as we are now so near the $1 level, which would remove the threat of a reverse split if it could be achieved and maintained for 10 days. This would be counter to what the shorters would like to see if they had been positioning themselves for that eventuality.
On the traditional TA front, movements were: __Open_ ___Low_ __High_ _Close_ Volume_
Today 7.14% 5.74% 6.52% 6.59% 61.23%
Prior -5.67% 0.95% -2.34% 1.20% -25.66%
These were nice movements accompanied by rising volume, indicating potential strength. However, keep in mind it's just a PR that apparently caused this, not a change in fundamentals as the revenue would still be woefully short of the $25MM/quarter needed for break-even. I'm thinking those with a negative outlook, especially shorters, will mount an attack, aided and abetted by swing and momo traders.
On my minimal chart, yesterday's expectation of [i\{ ... most likely move will be lower ... } was soundly thrashed by the apparent response to the PR. We did see, intr-day, the buy percentage weaken as we achieved the expected resistance point but it was ultimately swamped by the bullish price movements later in the day, as mentioned above, beginning around the time the "left coasties" could be expected to appear.
The most significant thing is that we penetrated and closed above that short-term triangle's resistance on rising volume. If we close above it again tomorrow, especially on good volume, we'll have a confirmed breakout. That would suggests $1 will be exceeded in the near-term. If the PR was good for only one day I would expect a fall back below that resistance on volume. That would be bad as I would then expect an almost-certain drop below the rising support of the triangle and more downside to follow.
The experimental 13-period Bollinger limits continued converging, but now with the limits converging on the mid-point at roughly the same rate, keeping the mid-point somewhat steady for now.
On my one-year chart, the 10-day SMA began a rise while the remaining SMAs continued falling. If we remain at this level, the 10-day will continue rising for at least 10-days, the 20-day will fall eight more days, and the 50-day would continue falling another 35 days or so. Being already below the 200-day, which will continue lower unabated, we need to see that 50-day begin climbing. Unfortunately, only a substantial rise into the $1.6x, initially, and then $1.4x areas will halt the decline of the 50-day.
Every oscillator I watch improved and all but MFI (untrusted by me) and accumulation/distribution are above neutral now - quite a reversal. Williams %R and full stochastic are overbought.
The experimental 13-period Bollinger limits, $0.7542 and $1.0108 ($0.7432 and $1.3010 yesterday) continued converging with the two limits converging on the mid-point at about the same rate, holding the mid-point somewhat steady now.
All in, nothing here suggests anything negative except the two overbought indications combined with a large volume spike, if you are a contrarian or, like me, swayed by a TFH. In that case you expect the shorters to jump all over this as their strategy for a coming reverse split would be at risk.
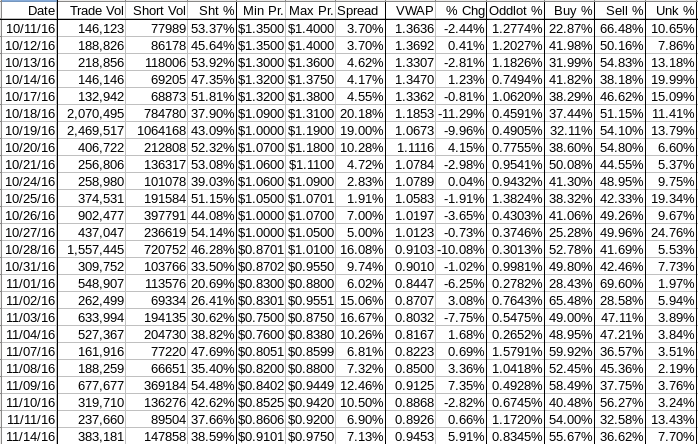
Percentages for daily short sales and buys moved in the same direction and, unusually, at about the same magnitude. The short percentage is nicely within the low end of my desired range (needs re-check) and the buy percentage moved further above 50%+, where sustainable appreciation becomes possible. The buy percentage was well-supported by the intra-day behavior, after the early-day weakness. Timing looks like a "left coasties" effect though so I'm not sure this will hold going forward.
Anyway, that's all good for now.
The spread widened but it's a good behavior as it was produced predominately by the longer intra-day climb above the resistance, which had capped behavior early in the day.
The VWAP's last twenty-four readings dropped from 14 negatives and 10 positives to 13 and 11 respectively. Change since 10/11 is -$0.4183, -30.68%, and the averages of the rolling 24-day period seen in the last few days (latest first) are now -1.3956%, -1.7433%, -1.8222%, -1.7635%, -1.8877%, -1.8884%, 1.9605%, -2.1754%, -1.7898%, and -1.8093%.
All in, near-term positive indications here.
Bill
 News
News  Market Data
  Discover


