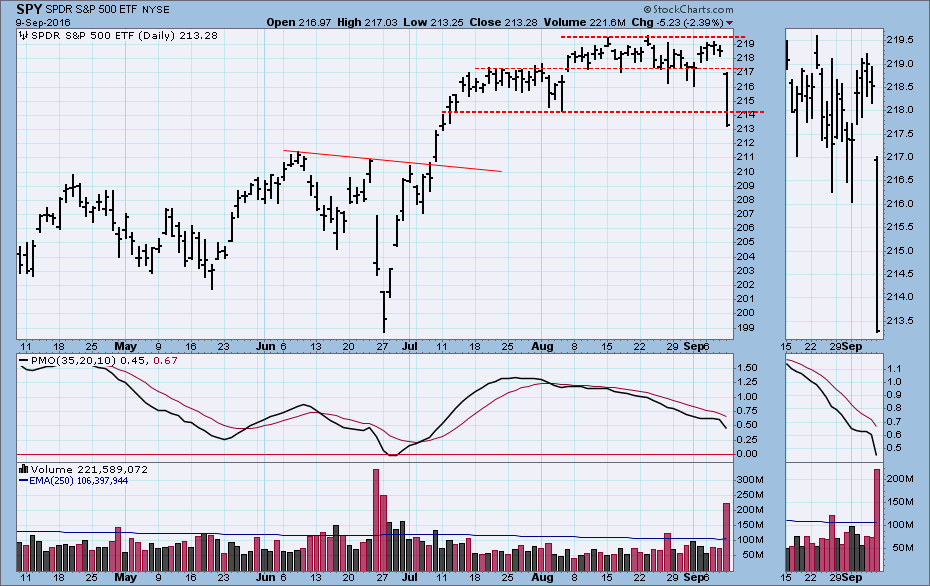
Last week in my article, Two More Months of This Stuff?, I wondered if the market would continue to move in the narrow, boring two-month trading range. This week we got the answer: No. The chart below shows Friday's high-volume breakdown through the support line drawn across the lowest point of the trading range.
When we zoom out for a broader context, we can see that price is approaching a rising trend line, off which we may see a bounce. However, this broader context also shows that the rising trend line is the bottom of a rising wedge pattern, the top of which is drawn from the April top. After Friday's breakdown, the rising wedge is the next clue that we may be in for several weeks of selling, because there is a high probability that the wedge will resolve downward.
The next chart shows our primary medium-term indicators for price, breadth, and volume. They have been trending downward for about two months, showing technical weakness in this time frame. They are around neutral and have plenty of room to move lower before they reach an oversold condition similar to the lows in January.
There is no guarantee that prices will continue lower for any significant period, but September and October are seasonally very negative months, so I have to say that this setup looks very dangerous.
CONCLUSION: We have: (1) a breakdown, (2) the negative implication of a rising wedge, (3) weak technicals, and (4) negative seasonality through October. In my opinion, this adds up to rough sailing for the bulls for several weeks.
Technical analysis is a windsock, not a crystal ball.
 News
News  Market Data
  Discover