InvestorsHub Logo
icon url

trader53

06/29/16 4:13 PM

#91163 RE: JUST WAITING #91162

ICNB - Ready to Run like ISBG

ICNB - Charts / News / Targets

Targets 0.0004 / 0.0006 / 0.002

http://investorshub.advfn.com/boards/read_msg.aspx?message_id=123427531&txt2find=icnb

ISBG Alerted at 0.0003 - Climbs to 0.0015
http://investorshub.advfn.com/boards/read_msg.aspx?message_id=123579238


icon url

trader53

06/29/16 5:44 PM

#91164 RE: JUST WAITING #91162

ICNB - Time & Sales / Targets

for Wednesday June 29, 2016


Shortable Stocks for United States

Availability:

https://www.interactivebrokers.com/en/index.php?key=icnb&cntry=usa&tag=United+States&ib_entity=llc&ln=&asset=&f=4587&conf=am&amref=1

http://shortsqueeze.com/?symbol=icnb&submit=Short+Quote%99

http://otcshortreport.com/index.php?index=ICNB&action=view


News / Targets
http://www.allotcbb.com/quote.php?symbol=icnb


MARKET MAKER SIGNALS

Penny traders believe that Market Makers (MM)
will "signal" moves in advance buy using
small amounts of buys or sells as "signals".

The "signals" are such a small amount of shares
(worth no more than 5 or 10 dollars) that
no trader would have paid a commission that
costs more than the amount of shares bought.

The "signals" are from one MM to another.

100 - I need shares.
200 - I need shares badly, but do not take the stock down.
300 - Take the price down so I can load shares
400 - Keep trading it sideways.
500 - Gap the stock.
This gap can be either up or down,
depending on the direction of the 500 signal.
911 - Pending News

Understanding the Form T-Trade:

If a market maker wants to accumulate
a large amount of a stock in one trading day,

that market maker may actually not report
any of the trades that occurred
until the trading day has ended
so as not to alert the market to the collection.

http://investorshub.advfn.com/boards/read_msg.aspx?message_id=120820833&txt2find=understanding


Time & Sales

Price Size Mkt Time


$0.0001 1,525,000 OTO 14:27:13
$0.0002 999,999 OTO 13:45:04
$0.0001 200 OTO 09:30:05


http://www.investorpoint.com/stock/ICNB-Iconic+Brands+Inc./market-makers-level2/


icon url

trader53

06/29/16 6:12 PM

#91175 RE: JUST WAITING #91162

ICNB - The Elliott Wave 5-Waves Sequence

* Embedded and Live! Charts
(See Live! Charts at Bottom of post)


Elliott Wave Basics
http://investorshub.advfn.com/boards/read_msg.aspx?message_id=113103065

Elliott Wave Principle
http://www.forexhit.com/learn-forex/elliott-wave-principle.html

Elliott Wave Theory
http://ta.mql4.com/elliott_wave_theory

Buy after an Elliott Wave,
5-Wave decline sequence !


A Basic "A,B,C Corrective Wave"
http://investorshub.advfn.com/boards/read_msg.aspx?message_id=113102933

Buy, ONLY when the stocks price,
is trading under the Blue 8-day M.A.
when the Blue 8-day M.A. is under the Red 34-day M.A.

http://investorshub.advfn.com/boards/read_msg.aspx?message_id=86382765


Live! Charts

http://bigcharts.marketwatch.com/quickchart/quickchart.asp?symb=icnb&insttype=&freq=1&show=&time=7

http://www.barchart.com/chart.php?sym=ICNB&style=technical&template=&p=DO&d=M&sd=&ed=&size=L&log=0&t=BAR&v=1&g=1&evnt=1&late=1&o1=&o2=&o3=&sh=100&indicators=SMA%2820%2C%29%3BPPO%2812%2C26%2C9%2C0%2C255%2C65280%29&chartindicator_3_code=SMA&chartindicator_3_param_0=20&chartindicator_3_param_1=&chartindicator_4_code=PPO&chartindicator_4_param_0=12&chartindicator_4_param_1=26&chartindicator_4_param_2=9&chartindicator_4_param_3=0&chartindicator_4_param_4=255&chartindicator_4_param_5=65280&addindicator=&submitted=1&fpage=&txtDate=


This stock has been going down,
and starts to trade sideways,
forming a base.

The sellers who once had the upper hand,
begin to lose their power,
because the buyers are starting to get more aggressive.

The stock just drifts sideways without a clear trend.

Everyone hates this stock!
This is the time to be Loading the Boat !!


http://investorshub.advfn.com/boards/read_msg.aspx?message_id=81775516


Impulse Wave 1 - The Accumulation Stage
the Wave right after a prolonged downtrend.


Wave 1

The stock makes its initial move upwards.
This is usually caused
by a relatively small number of people
that all of the sudden
(for a variety of reasons, real or imagined)
feel that the price of the stock is cheap
so it’s a perfect time to buy.
This causes the price to rise.


Wave 2 - Stock Declines

At this point,
enough people who were in the original wave
consider the stock overvalued and take profits.
This causes the stock to go down.
However, the stock will not make it to its previous lows
before the stock is considered a bargain again.


Wave 3

This is usually the longest and strongest wave.
The stock has caught the attention of the mass public.
More people find out about the stock and want to buy it.
This causes the stock’s price to go higher and higher.
This wave usually exceeds the high created at the end of Wave 1.


Wave 4

Traders take profits
because the stock is considered expensive again
.

This Wave tends to be weak
because there are usually more people
that are still bullish on the stock
and are waiting to “buy on the dips.”


Wave 5

This is the point that most people get in on the stock,
and is mostly driven by hysteria.

You usually start seeing the CEO of the company
on the front page of major magazines
as the Person of the Year.
Traders and investors start coming up with
ridiculous reasons to buy the stock
and try to choke you when you disagree with them.

This is when the stock becomes the most overpriced.
Contrarians start shorting the stock
which starts the ABC pattern.


Elliott Wave Basics
http://stockcharts.com/school/doku.php?id=chart_school:market_analysis:elliott_wave_theory

Basic Sequence

The chart below shows a rising 5-Wave sequence.

The entire Wave is up as it moves from the lower left
to the upper right of the chart.


Waves 1,3 and 5 are impulse waves
because they move with the trend.


Waves 2 and 4 are corrective waves
because they move against this bigger trend.


A basic impulse advance forms a 5-Wave sequence.


Wave 1

The stock makes its initial move upwards.
This is usually caused
by a relatively small number of people
that all of the sudden
(for a variety of reasons, real or imagined)
feel that the price of the stock is cheap
so it’s a perfect time to buy.
This causes the price to rise.

Wave 2

At this point,
enough people who were in the original wave
consider the stock overvalued and take profits.
This causes the stock to go down.
However, the stock will not make it to its previous lows
before the stock is considered a bargain again.

Wave 3

This is usually the longest and strongest wave.
The stock has caught the attention of the mass public.
More people find out about the stock and want to buy it.
This causes the stock’s price to go higher and higher.
This wave usually exceeds the high created at the end of Wave 1.

Wave 4

Traders take profits
because the stock is considered expensive again.
This Wave tends to be weak
because there are usually more people that are still bullish
on the stock and are waiting to “buy on the dips.”

Wave 5

This is the point that most people get in on the stock,
and is mostly driven by hysteria.

You usually start seeing the CEO of the company
on the front page of major magazines
as the Person of the Year.
Traders and investors start coming up with
ridiculous reasons to buy the stock
and try to choke you when you disagree with them.

This is when the stock becomes the most overpriced.
Contrarians start shorting the stock
which starts the ABC pattern.


Live! Charts

http://bigcharts.marketwatch.com/quickchart/quickchart.asp?symb=icnb&insttype=&freq=1&show=&time=7

http://www.barchart.com/chart.php?sym=ICNB&style=technical&template=&p=DO&d=M&sd=&ed=&size=L&log=0&t=BAR&v=1&g=1&evnt=1&late=1&o1=&o2=&o3=&sh=100&indicators=SMA%2820%2C%29%3BPPO%2812%2C26%2C9%2C0%2C255%2C65280%29&chartindicator_3_code=SMA&chartindicator_3_param_0=20&chartindicator_3_param_1=&chartindicator_4_code=PPO&chartindicator_4_param_0=12&chartindicator_4_param_1=26&chartindicator_4_param_2=9&chartindicator_4_param_3=0&chartindicator_4_param_4=255&chartindicator_4_param_5=65280&addindicator=&submitted=1&fpage=&txtDate=


icon url

trader53

06/29/16 6:40 PM

#91186 RE: JUST WAITING #91162

ICNB - Has a New Web-site !

ICNB - New Web-site
http://www.bivivodka.com/

Orders double for BiVi vodka
http://beverageworld.com/articles/full/17591/orders-double-for-bivi-vodka

BiVi Sicilian Vodka Unveils "Top-Shelf" Distributors
http://www.prnewswire.com/news-releases/bivi-sicilian-vodka-unveils-top-shelf-distributors-300135594.html

Palminteri unveils BiVi, first-ever Sicilian-style vodka
http://www.washingtontimes.com/news/2015/nov/6/chazz-palminteri-enters-vodka-market-sicilian-bivi/

http://lasvegassun.com/blogs/kats-report/2016/mar/03/a-vegas-tale-chazz-palminteri-to-talk-it-up-at-ita/

http://www.ny1.com/nyc/all-boroughs/zagat/2015/11/16/chazz-palminteri-combines-love-for-sicilian-heritage-and-classic-italian-food.html


Feb 10, 2016
BiVi 100% Sicilian Vodka


"Wins Gold Medal" as Demand Continues to Grow
http://www.otcmarkets.com/stock/ICNB/news/BiVi-100--Sicilian-Vodka--quot-Wins-Gold-Medal-quot--as-Demand-Continues-to-Grow?id=124982&b=y


Dec 09, 2015
Iconic

to Launch a Line of Organic Prosecco Wines
With Celebrity Spokesperson

http://www.otcmarkets.com/stock/ICNB/news/Iconic-to-Launch-a-Line-of-Organic-Prosecco-Wines-With-Celebrity-Spokesperson?id=121086&b=y


Dec 08, 2015
Iconic Brands

Continues With Marketing Success
for BiVi Sicilian Vodka
and the Addition of a New Product Line

http://www.otcmarkets.com/stock/ICNB/news/Iconic-Brands-Continues-With-Marketing-Success-for-BiVi-Sicilian-Vodka-and-the-Addition-of-a-New-Product-Line?id=120983&b=y


Targets 0.0006 / 0.002 / 0.006 / 0.0069

ICNB Security Details
Share Structure

Market Value1...........$75,165 a/o Jun 28, 2016
Authorized Shares 2,500,000,000 a/o Mar 31, 2016
Outstanding Shares..375,823,721 a/o Mar 31, 2016
Float...............375,823,721 a/o Mar 31, 2016
Par Value 0.001


ICNB - News / Filings

http://www.otcmarkets.com/stock/ICNB/profile

http://www.otcmarkets.com/stock/ICNB/news

http://www.otcmarkets.com/stock/ICNB/filings


Live! Charts

http://bigcharts.marketwatch.com/quickchart/quickchart.asp?symb=icnb&insttype=&freq=1&show=&time=7

http://www.barchart.com/chart.php?sym=ICNB&style=technical&template=&p=DO&d=M&sd=&ed=&size=L&log=0&t=BAR&v=1&g=1&evnt=1&late=1&o1=&o2=&o3=&sh=100&indicators=SMA%2820%2C%29%3BPPO%2812%2C26%2C9%2C0%2C255%2C65280%29&chartindicator_3_code=SMA&chartindicator_3_param_0=20&chartindicator_3_param_1=&chartindicator_4_code=PPO&chartindicator_4_param_0=12&chartindicator_4_param_1=26&chartindicator_4_param_2=9&chartindicator_4_param_3=0&chartindicator_4_param_4=255&chartindicator_4_param_5=65280&addindicator=&submitted=1&fpage=&txtDate=


icon url

trader53

06/29/16 7:37 PM

#91189 RE: JUST WAITING #91162

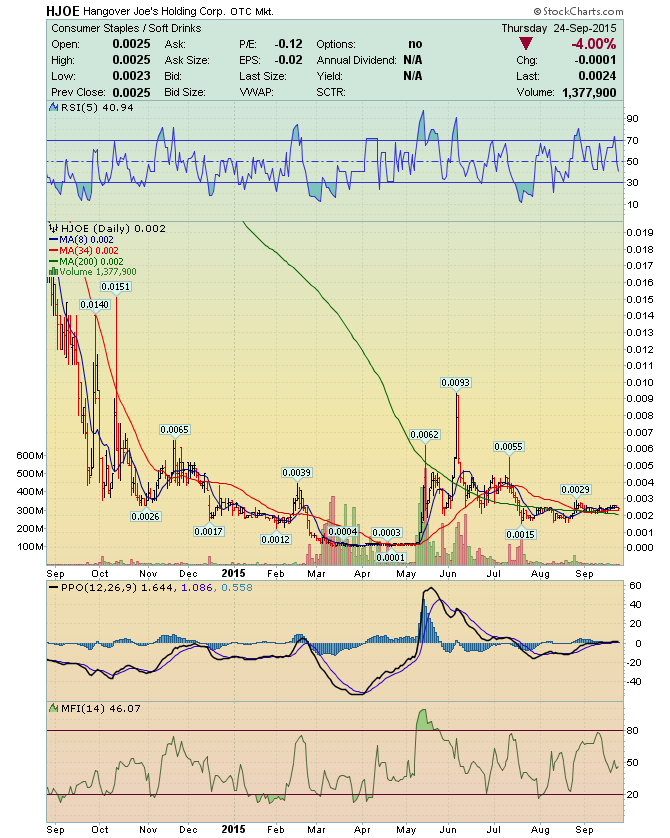
ICNB - Can Climb like HJOE

ICNB Targets 0.0006 / 0.002 / 0.006 / 0.009

HJOE Alerted at 0.0002 - Climbs to 0.0062 and 0.0093
http://investorshub.advfn.com/boards/read_msg.aspx?message_id=122152653
http://investorshub.advfn.com/boards/read_msg.aspx?message_id=123453108

HJOE
http://investorshub.advfn.com/boards/read_msg.aspx?message_id=123453108

ICNB
http://investorshub.advfn.com/boards/read_msg.aspx?message_id=123452760


* Both Decline from 0.01 in October and bottom at 0.002

* Both climb to 0.006 in November

* Both decline to 0.0012 in February

* Both climb to 0.004 in February

* Both Decline to 0.0001 in April and move sideways into May


ICNB Targets 0.0006 / 0.002 / 0.006 / 0.009

* Both Decline from 0.01 in October and bottom at 0.002

* Both climb to 0.006 in November

* Both decline to 0.0012 in February

* Both climb to 0.004 in February

* Both Decline to 0.0001 in April and move sideways into May

icon url

trader53

06/29/16 8:35 PM

#91195 RE: JUST WAITING #91162

ICNB Iconic Brands Continues With Marketing Success

for BiVi Sicilian Vodka
and the Addition of a New Product Line

http://www.otcmarkets.com/stock/ICNB/news/Iconic-Brands-Continues-With-Marketing-Success-for-BiVi-Sicilian-Vodka-and-the-Addition-of-a-New-Product-Line?id=120983&b=y


icon url

trader53

06/30/16 5:25 AM

#91216 RE: JUST WAITING #91162

ICNB - Can Climb like HJOE

ICNB 0.0002 - Targets 0.0006 / 0.002 / 0.006 / 0.009

HJOE Alerted at 0.0002 - Climbs to 0.0062 and 0.0093

http://investorshub.advfn.com/boards/read_msg.aspx?message_id=123613269


icon url

trader53

06/30/16 6:22 AM

#91218 RE: JUST WAITING #91162

ICNB Has "Walk-down-Gaps" at 0.0006/0.0007

...that will get filled, on the upcoming Run !

There is an old saying that
"the market abhors a vacuum, and all gaps will be filled."

Gaps
are a significant technical development in price action
and chart analysis, and should not be ignored.


Gap:

Gaps form when opening price movements
create a blank spot on the chart.

This occurs when the high of the day
is below the low of the previous day
or when the low of the day
is above the high of the previous day.

Gaps are especially significant
when accompanied by an increase in volume.

Gaps and Gap Analysis
http://stockcharts.com/school/doku.php?id=chart_school:glossary_g
http://stockcharts.com/school/doku.php?id=chart_school:chart_analysis:gaps_and_gap_analysis


icon url

trader53

06/30/16 6:33 AM

#91219 RE: JUST WAITING #91162

ICNB to fill Gap like ISBG did !


ISBG - Gap at 0.0007 / 0.0008 to get filled !

A "Walk-down-Gap" exists at 0.0008 and 0.0007

and it will get filled shortly !

(See Gap in late February on Chart below)

Alerted
Wednesday, 04/20/16

ISBG - Gap at 0.0007 / 0.0008 to get filled !
http://investorshub.advfn.com/boards/read_msg.aspx?message_id=122044028&txt2find=isbg


ICNB Has "Walk-down-Gaps" at 0.0006/0.0007

...that will get filled, on the upcoming Run !

There is an old saying that
"the market abhors a vacuum, and all gaps will be filled."

Gaps
are a significant technical development in price action
and chart analysis, and should not be ignored.


Gap:

Gaps form when opening price movements
create a blank spot on the chart.

This occurs when the high of the day
is below the low of the previous day
or when the low of the day
is above the high of the previous day.

Gaps are especially significant
when accompanied by an increase in volume.

Gaps and Gap Analysis
http://stockcharts.com/school/doku.php?id=chart_school:glossary_g
http://stockcharts.com/school/doku.php?id=chart_school:chart_analysis:gaps_and_gap_analysis


icon url

trader53

06/30/16 7:27 AM

#91220 RE: JUST WAITING #91162

ICNB Transfer Agent - Not Gagged !

Per Company Legal Counsel and Transfer Agent.

Matheau J.W. Stout Esq.
Legal Counsel
http://www.otcmarkets.com/research/service-provider/Matheau-J.W.-Stout-Esq.?id=4837&b=n&filterOn=3


All Share Structure information is Current.

It is the Policy of this TA,
that they will not release any information,
on all of the companies that they represent -

http://www.otcmarkets.com/stock/ICNB/filings

web: http://www.islandstocktransfer.com

Transfer Agent e-mail Reply


Hello:

Unfortunately we cannot release this information at this time.

Please contact the Company directly.

Thank you.

Sincerely,

Olessia Kritskaia


I s l a n d S t o c k T r a n s f e r

Full Service Transfer Agency

15500 Roosevelt Boulevard, Suite 301

Clearwater, Florida 33760

Office phone: 727-289-0010 ext. 243

Fax: 727-289-0069

Email: mailto:olessia@islandstocktransfer.com


Our mission statement:

Island Stock Transfer
is committed to providing the highest level of responsiveness, efficiency and customer service at competitive prices enabled by state of the art technology and highly trained experts in Transfer services and processing.


icon url

trader53

06/30/16 5:23 PM

#91250 RE: JUST WAITING #91162

ICNB - Time & Sales / Targets

for Thursday June 30, 2016

Bid 0.0001/12M x Ask 0.0002/76M


Shortable Stocks for United States

Availability:

https://www.interactivebrokers.com/en/index.php?key=icnb&cntry=usa&tag=United+States&ib_entity=llc&ln=&asset=&f=4587&conf=am&amref=1

http://shortsqueeze.com/?symbol=icnb&submit=Short+Quote%99

http://otcshortreport.com/index.php?index=ICNB&action=view


News / Targets
http://www.allotcbb.com/quote.php?symbol=icnb


MARKET MAKER SIGNALS

Penny traders believe that Market Makers (MM)
will "signal" moves in advance buy using
small amounts of buys or sells as "signals".

The "signals" are such a small amount of shares
(worth no more than 5 or 10 dollars) that
no trader would have paid a commission that
costs more than the amount of shares bought.

The "signals" are from one MM to another.

100 - I need shares.
200 - I need shares badly, but do not take the stock down.
300 - Take the price down so I can load shares
400 - Keep trading it sideways.
500 - Gap the stock.
This gap can be either up or down,
depending on the direction of the 500 signal.
911 - Pending News

Understanding the Form T-Trade:

If a market maker wants to accumulate
a large amount of a stock in one trading day,

that market maker may actually not report
any of the trades that occurred
until the trading day has ended
so as not to alert the market to the collection.

http://investorshub.advfn.com/boards/read_msg.aspx?message_id=120820833&txt2find=understanding


Time & Sales

Price Size Mkt Time


$0.0002 100,000 OTO 11:13:22


http://www.investorpoint.com/stock/ICNB-Iconic+Brands+Inc./market-makers-level2/


icon url

trader53

07/01/16 4:43 AM

#91271 RE: JUST WAITING #91162

ICNB - The Elliott Wave 5-Waves Sequence

* Embedded and Live! Charts
(See Live! Charts at Bottom of post)


Elliott Wave Basics
http://investorshub.advfn.com/boards/read_msg.aspx?message_id=113103065

Elliott Wave Principle
http://www.forexhit.com/learn-forex/elliott-wave-principle.html

Elliott Wave Theory
http://ta.mql4.com/elliott_wave_theory

Buy after an Elliott Wave,
5-Wave decline sequence !


A Basic "A,B,C Corrective Wave"
http://investorshub.advfn.com/boards/read_msg.aspx?message_id=113102933

Buy, ONLY when the stocks price,
is trading under the Blue 8-day M.A.
when the Blue 8-day M.A. is under the Red 34-day M.A.

http://investorshub.advfn.com/boards/read_msg.aspx?message_id=86382765


Live! Charts

http://bigcharts.marketwatch.com/quickchart/quickchart.asp?symb=icnb&insttype=&freq=1&show=&time=7

http://www.barchart.com/chart.php?sym=ICNB&style=technical&template=&p=DO&d=M&sd=&ed=&size=L&log=0&t=BAR&v=1&g=1&evnt=1&late=1&o1=&o2=&o3=&sh=100&indicators=SMA%2820%2C%29%3BPPO%2812%2C26%2C9%2C0%2C255%2C65280%29&chartindicator_3_code=SMA&chartindicator_3_param_0=20&chartindicator_3_param_1=&chartindicator_4_code=PPO&chartindicator_4_param_0=12&chartindicator_4_param_1=26&chartindicator_4_param_2=9&chartindicator_4_param_3=0&chartindicator_4_param_4=255&chartindicator_4_param_5=65280&addindicator=&submitted=1&fpage=&txtDate=


This stock has been going down,
and starts to trade sideways,
forming a base.

The sellers who once had the upper hand,
begin to lose their power,
because the buyers are starting to get more aggressive.

The stock just drifts sideways without a clear trend.

Everyone hates this stock!
This is the time to be Loading the Boat !!


http://investorshub.advfn.com/boards/read_msg.aspx?message_id=81775516


Impulse Wave 1 - The Accumulation Stage
the Wave right after a prolonged downtrend.


Wave 1

The stock makes its initial move upwards.
This is usually caused
by a relatively small number of people
that all of the sudden
(for a variety of reasons, real or imagined)
feel that the price of the stock is cheap
so it’s a perfect time to buy.
This causes the price to rise.


Wave 2 - Stock Declines

At this point,
enough people who were in the original wave
consider the stock overvalued and take profits.
This causes the stock to go down.
However, the stock will not make it to its previous lows
before the stock is considered a bargain again.


Wave 3

This is usually the longest and strongest wave.
The stock has caught the attention of the mass public.
More people find out about the stock and want to buy it.
This causes the stock’s price to go higher and higher.
This wave usually exceeds the high created at the end of Wave 1.


Wave 4

Traders take profits
because the stock is considered expensive again
.

This Wave tends to be weak
because there are usually more people
that are still bullish on the stock
and are waiting to “buy on the dips.”


Wave 5

This is the point that most people get in on the stock,
and is mostly driven by hysteria.

You usually start seeing the CEO of the company
on the front page of major magazines
as the Person of the Year.
Traders and investors start coming up with
ridiculous reasons to buy the stock
and try to choke you when you disagree with them.

This is when the stock becomes the most overpriced.
Contrarians start shorting the stock
which starts the ABC pattern.


Elliott Wave Basics
http://stockcharts.com/school/doku.php?id=chart_school:market_analysis:elliott_wave_theory

Basic Sequence

The chart below shows a rising 5-Wave sequence.

The entire Wave is up as it moves from the lower left
to the upper right of the chart.


Waves 1,3 and 5 are impulse waves
because they move with the trend.


Waves 2 and 4 are corrective waves
because they move against this bigger trend.


A basic impulse advance forms a 5-Wave sequence.


Wave 1

The stock makes its initial move upwards.
This is usually caused
by a relatively small number of people
that all of the sudden
(for a variety of reasons, real or imagined)
feel that the price of the stock is cheap
so it’s a perfect time to buy.
This causes the price to rise.

Wave 2

At this point,
enough people who were in the original wave
consider the stock overvalued and take profits.
This causes the stock to go down.
However, the stock will not make it to its previous lows
before the stock is considered a bargain again.

Wave 3

This is usually the longest and strongest wave.
The stock has caught the attention of the mass public.
More people find out about the stock and want to buy it.
This causes the stock’s price to go higher and higher.
This wave usually exceeds the high created at the end of Wave 1.

Wave 4

Traders take profits
because the stock is considered expensive again.
This Wave tends to be weak
because there are usually more people that are still bullish
on the stock and are waiting to “buy on the dips.”

Wave 5

This is the point that most people get in on the stock,
and is mostly driven by hysteria.

You usually start seeing the CEO of the company
on the front page of major magazines
as the Person of the Year.
Traders and investors start coming up with
ridiculous reasons to buy the stock
and try to choke you when you disagree with them.

This is when the stock becomes the most overpriced.
Contrarians start shorting the stock
which starts the ABC pattern.


Live! Charts

http://bigcharts.marketwatch.com/quickchart/quickchart.asp?symb=icnb&insttype=&freq=1&show=&time=7

http://www.barchart.com/chart.php?sym=ICNB&style=technical&template=&p=DO&d=M&sd=&ed=&size=L&log=0&t=BAR&v=1&g=1&evnt=1&late=1&o1=&o2=&o3=&sh=100&indicators=SMA%2820%2C%29%3BPPO%2812%2C26%2C9%2C0%2C255%2C65280%29&chartindicator_3_code=SMA&chartindicator_3_param_0=20&chartindicator_3_param_1=&chartindicator_4_code=PPO&chartindicator_4_param_0=12&chartindicator_4_param_1=26&chartindicator_4_param_2=9&chartindicator_4_param_3=0&chartindicator_4_param_4=255&chartindicator_4_param_5=65280&addindicator=&submitted=1&fpage=&txtDate=


icon url

trader53

07/02/16 4:41 AM

#91352 RE: JUST WAITING #91162

ICNB - The Elliott Wave 5-Waves Sequence

* Embedded and Live! Charts
(See Live! Charts at Bottom of post)


Elliott Wave Basics
http://investorshub.advfn.com/boards/read_msg.aspx?message_id=113103065

Elliott Wave Principle
http://www.forexhit.com/learn-forex/elliott-wave-principle.html

Elliott Wave Theory
http://ta.mql4.com/elliott_wave_theory

Buy after an Elliott Wave,
5-Wave decline sequence !


A Basic "A,B,C Corrective Wave"
http://investorshub.advfn.com/boards/read_msg.aspx?message_id=113102933

Buy, ONLY when the stocks price,
is trading under the Blue 8-day M.A.
when the Blue 8-day M.A. is under the Red 34-day M.A.

http://investorshub.advfn.com/boards/read_msg.aspx?message_id=86382765


Live! Charts

http://bigcharts.marketwatch.com/quickchart/quickchart.asp?symb=icnb&insttype=&freq=1&show=&time=7

http://www.barchart.com/chart.php?sym=ICNB&style=technical&template=&p=DO&d=M&sd=&ed=&size=L&log=0&t=BAR&v=1&g=1&evnt=1&late=1&o1=&o2=&o3=&sh=100&indicators=SMA%2820%2C%29%3BPPO%2812%2C26%2C9%2C0%2C255%2C65280%29&chartindicator_3_code=SMA&chartindicator_3_param_0=20&chartindicator_3_param_1=&chartindicator_4_code=PPO&chartindicator_4_param_0=12&chartindicator_4_param_1=26&chartindicator_4_param_2=9&chartindicator_4_param_3=0&chartindicator_4_param_4=255&chartindicator_4_param_5=65280&addindicator=&submitted=1&fpage=&txtDate=


This stock has been going down,
and starts to trade sideways,
forming a base.

The sellers who once had the upper hand,
begin to lose their power,
because the buyers are starting to get more aggressive.

The stock just drifts sideways without a clear trend.

Everyone hates this stock!
This is the time to be Loading the Boat !!


http://investorshub.advfn.com/boards/read_msg.aspx?message_id=81775516


Impulse Wave 1 - The Accumulation Stage
the Wave right after a prolonged downtrend.


Wave 1

The stock makes its initial move upwards.
This is usually caused
by a relatively small number of people
that all of the sudden
(for a variety of reasons, real or imagined)
feel that the price of the stock is cheap
so it’s a perfect time to buy.
This causes the price to rise.


Wave 2 - Stock Declines

At this point,
enough people who were in the original wave
consider the stock overvalued and take profits.
This causes the stock to go down.
However, the stock will not make it to its previous lows
before the stock is considered a bargain again.


Wave 3

This is usually the longest and strongest wave.
The stock has caught the attention of the mass public.
More people find out about the stock and want to buy it.
This causes the stock’s price to go higher and higher.
This wave usually exceeds the high created at the end of Wave 1.


Wave 4

Traders take profits
because the stock is considered expensive again
.

This Wave tends to be weak
because there are usually more people
that are still bullish on the stock
and are waiting to “buy on the dips.”


Wave 5

This is the point that most people get in on the stock,
and is mostly driven by hysteria.

You usually start seeing the CEO of the company
on the front page of major magazines
as the Person of the Year.
Traders and investors start coming up with
ridiculous reasons to buy the stock
and try to choke you when you disagree with them.

This is when the stock becomes the most overpriced.
Contrarians start shorting the stock
which starts the ABC pattern.


Elliott Wave Basics
http://stockcharts.com/school/doku.php?id=chart_school:market_analysis:elliott_wave_theory

Basic Sequence

The chart below shows a rising 5-Wave sequence.

The entire Wave is up as it moves from the lower left
to the upper right of the chart.


Waves 1,3 and 5 are impulse waves
because they move with the trend.


Waves 2 and 4 are corrective waves
because they move against this bigger trend.


A basic impulse advance forms a 5-Wave sequence.


Wave 1

The stock makes its initial move upwards.
This is usually caused
by a relatively small number of people
that all of the sudden
(for a variety of reasons, real or imagined)
feel that the price of the stock is cheap
so it’s a perfect time to buy.
This causes the price to rise.

Wave 2

At this point,
enough people who were in the original wave
consider the stock overvalued and take profits.
This causes the stock to go down.
However, the stock will not make it to its previous lows
before the stock is considered a bargain again.

Wave 3

This is usually the longest and strongest wave.
The stock has caught the attention of the mass public.
More people find out about the stock and want to buy it.
This causes the stock’s price to go higher and higher.
This wave usually exceeds the high created at the end of Wave 1.

Wave 4

Traders take profits
because the stock is considered expensive again.
This Wave tends to be weak
because there are usually more people that are still bullish
on the stock and are waiting to “buy on the dips.”

Wave 5

This is the point that most people get in on the stock,
and is mostly driven by hysteria.

You usually start seeing the CEO of the company
on the front page of major magazines
as the Person of the Year.
Traders and investors start coming up with
ridiculous reasons to buy the stock
and try to choke you when you disagree with them.

This is when the stock becomes the most overpriced.
Contrarians start shorting the stock
which starts the ABC pattern.


Live! Charts

http://bigcharts.marketwatch.com/quickchart/quickchart.asp?symb=icnb&insttype=&freq=1&show=&time=7

http://www.barchart.com/chart.php?sym=ICNB&style=technical&template=&p=DO&d=M&sd=&ed=&size=L&log=0&t=BAR&v=1&g=1&evnt=1&late=1&o1=&o2=&o3=&sh=100&indicators=SMA%2820%2C%29%3BPPO%2812%2C26%2C9%2C0%2C255%2C65280%29&chartindicator_3_code=SMA&chartindicator_3_param_0=20&chartindicator_3_param_1=&chartindicator_4_code=PPO&chartindicator_4_param_0=12&chartindicator_4_param_1=26&chartindicator_4_param_2=9&chartindicator_4_param_3=0&chartindicator_4_param_4=255&chartindicator_4_param_5=65280&addindicator=&submitted=1&fpage=&txtDate=


icon url

trader53

07/02/16 6:32 AM

#91384 RE: JUST WAITING #91162

ICNB - Time & Sales / Targets

for Friday July 1, 2016

Vol 20,704,593

Bid | Size
0.0001 | 59,088,700 <-- Stackin'

Ask | Size
0.0002 | 133,909,000


Shortable Stocks for United States

Availability:

https://www.interactivebrokers.com/en/index.php?key=icnb&cntry=usa&tag=United+States&ib_entity=llc&ln=&asset=&f=4587&conf=am&amref=1

http://shortsqueeze.com/?symbol=icnb&submit=Short+Quote%99

http://otcshortreport.com/index.php?index=ICNB&action=view


News / Targets
http://www.allotcbb.com/quote.php?symbol=icnb


MARKET MAKER SIGNALS

Penny traders believe that Market Makers (MM)
will "signal" moves in advance buy using
small amounts of buys or sells as "signals".

The "signals" are such a small amount of shares
(worth no more than 5 or 10 dollars) that
no trader would have paid a commission that
costs more than the amount of shares bought.

The "signals" are from one MM to another.

100 - I need shares.
200 - I need shares badly, but do not take the stock down.
300 - Take the price down so I can load shares
400 - Keep trading it sideways.
500 - Gap the stock.
This gap can be either up or down,
depending on the direction of the 500 signal.
911 - Pending News

Understanding the Form T-Trade:

If a market maker wants to accumulate
a large amount of a stock in one trading day,

that market maker may actually not report
any of the trades that occurred
until the trading day has ended
so as not to alert the market to the collection.

http://investorshub.advfn.com/boards/read_msg.aspx?message_id=120820833&txt2find=understanding


Time & Sales

Price Size Mkt Time


$0.0001 1,894,793 OTO 11:12:58
$0.0001 8,874,800 OTO 11:12:48

$0.0002 650,000 OTO 09:49:55

$0.0001 4,500,000 OTO 09:43:08
$0.0001 1,500,000 OTO 09:42:06

$0.0002 285,000 OTO 09:33:23
$0.0002 1,500,000 OTO 09:30:06
$0.0002 99,999 OTO 09:30:01
$0.0002 400,001 OTO 09:30:01

$0.0002 500,000 OTO 09:30:00


http://www.investorpoint.com/stock/ICNB-Iconic+Brands+Inc./market-makers-level2/


icon url

trader53

07/08/16 7:23 AM

#92000 RE: JUST WAITING #91162

ICNB Bid 0.0001 - Ask 0.0004

Targets 0.0004 / 0.0006 / 0.002 / 0.006 / 0.009
http://www.allotcbb.com/quote.php?symbol=icnb


ICNB - Charts / News / Targets
http://investorshub.advfn.com/boards/read_msg.aspx?message_id=123640746


icon url

trader53

07/08/16 8:56 AM

#92004 RE: JUST WAITING #91162

ICNB Bid 0.0001/20,000 - Ask 0.0002/10,000

Targets 0.0004 / 0.0006 / 0.002 / 0.006 / 0.009
http://www.allotcbb.com/quote.php?symbol=icnb


ICNB - Charts / News / Targets
http://investorshub.advfn.com/boards/read_msg.aspx?message_id=123640746

icon url

trader53

07/08/16 9:02 AM

#92005 RE: JUST WAITING #91162

ICNB - DEWM - Low Floaters

DEWM - from 0.0001 to 0.033

ICNB - Targets 0.0004 / 0.0006 / 0.002 / 0.006 / 0.009 / 0.03

http://investorshub.advfn.com/boards/read_msg.aspx?message_id=123672644&txt2find=dewm

icon url

trader53

07/08/16 9:43 AM

#92006 RE: JUST WAITING #91162

ICNB Bid 0.0001/27M - Ask 0.0002/61M


Bid | Size
0.0001 | 27,899,900

Ask | Size
0.0002 | 61,621,800 <-- Falling !


Targets 0.0004 / 0.0006 / 0.002 / 0.006 / 0.009
http://www.allotcbb.com/quote.php?symbol=icnb


ICNB - Charts / News / Targets
http://investorshub.advfn.com/boards/read_msg.aspx?message_id=123640746

icon url

trader53

07/08/16 9:50 AM

#92007 RE: JUST WAITING #91162

ICNB Bid 0.0001/27M - Ask 0.0002/45M


Bid | Size
0.0001 | 27,899,900

Ask | Size
0.0002 | 45,621,900 <-- Falling !


Targets 0.0004 / 0.0006 / 0.002 / 0.006 / 0.009
http://www.allotcbb.com/quote.php?symbol=icnb


ICNB - Charts / News / Targets
http://investorshub.advfn.com/boards/read_msg.aspx?message_id=123640746

icon url

trader53

07/08/16 9:53 AM

#92008 RE: JUST WAITING #91162

ICNB Bid 0.0001/44M - Ask 0.0002/45M


Bid | Size
0.0001 | 44,899,900

Ask | Size
0.0002 | 45,621,900 <-- Falling !


Targets 0.0004 / 0.0006 / 0.002 / 0.006 / 0.009
http://www.allotcbb.com/quote.php?symbol=icnb


ICNB - Charts / News / Targets
http://investorshub.advfn.com/boards/read_msg.aspx?message_id=123640746

icon url

trader53

07/08/16 9:55 AM

#92009 RE: JUST WAITING #91162

ICNB Bid 0.0001/54M - Ask 0.0002/43M


Bid | Size
0.0001 | 54,899,900

Ask | Size
0.0002 | 43,821,900 <-- Falling !


Targets 0.0004 / 0.0006 / 0.002 / 0.006 / 0.009
http://www.allotcbb.com/quote.php?symbol=icnb


ICNB - Charts / News / Targets
http://investorshub.advfn.com/boards/read_msg.aspx?message_id=123640746

icon url

trader53

07/08/16 9:59 AM

#92010 RE: JUST WAITING #91162

ICNB 0.0002 - Only 33M Left


Bid | Size
0.0001 | 53,899,900

Ask | Size
0.0002 | 33,821,900 <-- Falling !


Targets 0.0004 / 0.0006 / 0.002 / 0.006 / 0.009
http://www.allotcbb.com/quote.php?symbol=icnb


ICNB - Charts / News / Targets
http://investorshub.advfn.com/boards/read_msg.aspx?message_id=123640746

icon url

trader53

08/22/16 6:13 PM

#95254 RE: JUST WAITING #91162

ICNB - Bellissima Prosecco Video

Published on Jun 18, 2016

Hot New Brand on Hotmixology

BELLISSIMA PROSECCO
with Christie Brinkley