Spooky inconsistencies along with extreme flatness today makes me both suspicious of the the market action and not positive. There's some small indication we could be bottoming - I just can't believe it while we have the inconsistencies.
There were no pre-market trades.
09:30-10:00 opened the day with a 2,784 buy for $1.67 and then got 9:33's 640 $1.65->$1.67, 9:34's ~1.12K $1.67, 9:35's 500 $1.67, 9:37's 1K $1.67, 9:38's ~2.9K $1.65/6, 9:41's 370 $1.65, 9:43's 234 $1.67, 9:44's 2.4K $1.67->$1.65, 9:45-10:00's no, low, and medium-volume $1.66/7 to end the period on 10:00's ~1.2K $1.66.
10:01-10:15 began a drop doing 10:01-:02's ~5K $1.65, 10:05's ~22.7K $1.65->$1.64, and 10:15's ~2.9 $1.64->$1.63 to end the period.
10:16-15:13, after a no-trades nine minutes, began a rise on 10:25's 251 $1.64, 10:33's 2405 $1.65, and began flattish $1.65 on 10:34's 20.4K $1.65, 10:37-:38's ~14.5K $1.65, and 10:39-12:37's mostly no and some low volume $1.64/5, 12:38-13:08's mixed no, low, high, and medium volume $1.64/5 (interrupted by 12:56-:59's 3K $$1.63/4), 13:09-15:13's 1.64/5 with volume mostly no, some low, a couple medium, and three "higher" minutes, and ended the period on 15:13's ~5.6K $1.65.
15:14-16:00 began a climb higher on 15:14-:16's ~10.2K $1.65/6, 15:17-27's very low/no-volume dropped back to $1.64/5, 15:28-15:53 resumed a very low-volume climb when it did 15:28's 400 $1.65/6, 15:33's 600 $1.66/7, 15:53's ~5.3K $1.67->$1.66->$1.68, did 15:54-:59's flattish ~3.7K $1.66/7, and closed the period and day with 16:00's 1,184 buy for $1.67.
There were no AH trades.
Excluding the opening and closing trades (didn't qualify), there were 5 larger trades (>=5K & 2 4K+) totaling 36,300, 11.23% of day's volume, with a $1.6494 VWAP. This is the smallest percentage of day's volume constituted by "larger" trades in a lng while. The count is pretty low too, although we have seen such low numbers somewhat recently.
It's been a very long time since we've seen such a long flat intra-day. In the deep past this used to be a common Friday occurrence. No so these recent days.
N.B. Yesterday I inadvertently noted the 4/26 candlestick discussed the doji candlestick in two places. [ERROR! Doji was 4/26. Please ignore that for the 4/25 post.]
On my minimal chart yesterday I said { ... on a down day with a larger spread we have increasing volume. Worse than that, the prior three days combined with today is starting a cupping pattern on the volume bars with the rise coming on the right side of the cupping pattern during a down move. The rise wasn't enough to consider it end a down trend. So that suggests more near-term downside is likely. } Today fit the bill if you consider other than the open and close, which was flat. That was in line with one of the flattest intra-day patterns we've seen for a long while. This is abnormal when you consider some of the recent behavior.
Regardless, at least we got volume low enough to now surmise that we might be approaching a bottom. The doji fits with indecision, which often appears at potential points of behavioral change. The fly in the ointment is the unconventional stuff below which also suggests abnormality.
Today we confirmed yesterday's { ... we penetrated the $1.67-$1.70 potential resistance (orange line) and closed below it. If we close below again tomorrow the conventional TA says the support break is confirmed and we can expect further movement towards the next potential support. ... either the rising green line, ~ $1.55 today ... The next potential support is the $1.53 price (upper red line) ... I would expect at least a pause there, considering only conventional TA, with a rebound up some before falling to test the support again. We'll be better able to assess the likely behavior once we get down there.which I'm thinking will happen in the near future ... } Keep in mind yesterday's caveats about the green line and one concern about the red line.
Yesterday's erroneous post is valid today. We have a particular candlestick pattern here, a "Southern Doji" which is supposed to act as a bullish reversal. Unfortunately Bulkowski notes it does so only 52% of the time, essentially random. Personally I'm reading this as nothing but a pause as others who do charts recognize the potential support and wait to see if it will break back above. If not, the momo and swing traders will likely dump, adding to whatever pressure is generated by the ATM (if still in use) and selling by the financiers (but they could be out of shares already? Especially if they shorted in advance of receiving the shares and used the received shares to cover their short positions).
I would add to that my unconventional stuff makes this look very strange. I touch on that below.
On my one-year chart not much changed. 10, 20 and 50-day SMAs still rising. The 10-day has one more day, if price range doesn't rise, before it starts to roll over.
The oscillators I watch had a flat RSI, and marginally improved accumulation/distribution and MFI. Weakening momentum,s seen in Williams %R (made oversold), full stochastic (even deeper into oversold), and ADX-related.
The 13-period Bollinger limits, $1.2719 and $2.3665 ($1.1993 and $2.3915 yesterday) continue converging with a faster-rising lower limit causing the mid-point to continue rising.
All in, everything but the volume and doji suggests near-term weakness will continue. Those two exceptions offer the unwary a glimmer of hope. It could work out but I won't "hope" based on them.
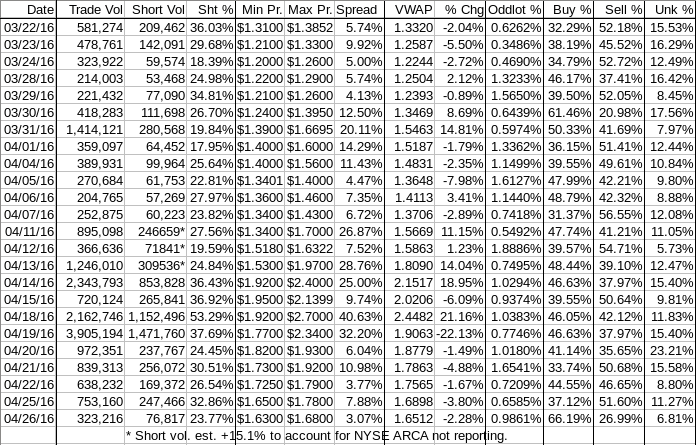
Percentages for daily short sales and buys moved in opposite directions big time!. Several concerns related to what we see. First the short percentage is way below the desired range of "normalcy" (needs re-check), it got there on a relatively big move when the buy percentage suggests it should have at least held steady. With very few larger trades, I suspect the ATM was being used because they would generate no short sales.
Second, this buy percentage is absolutely unsustainable in the current environment. Worse, it's totally inconsistent with a lack of price rise. What I saw intra-day suggest some sort of manipulation as very often the bids stayed close to the offers and were often far outweighed by the offers but very few hits of the bid occurred. There was little movement in the b/a range after the initial opening 45 minutes.
Could be just covering buys by the shorters elevated the buy percentage, which would fit with the Short Report of 04/15/16. Could be MMs covering. I doubt ATM as that usually has a low buy percentage.
The spread contracted nicely and was in a normal range. Combined with volume we could hope for an end of the down trend being near. I'm suspicious because of today's intra-day action and the short/buy percentage inconsistencies.
VWAP movement was down in spite of the apparent flatness, based on open and close and the buy percentage which in normal times should have pushed price up.
All in, I don't believe the buy percentage and it's not supported by volume. So it doesn't give us a reason to think upward is near. Short percentage also give no reason to think there's any normal support for upward movement.
As always, much is experimental and should be treated as such.
 News
News  Market Data
  Discover