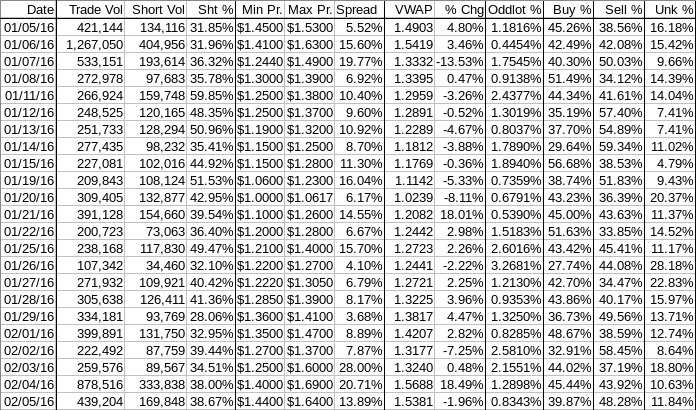
Buy:sell, daily shorts & pps 02/05 2016 EOD
Yesterday I noted { A 100-share AH $1.58 trade makes my TFH quiver. Open high suggested. Followed by down? }
Well, we opened at $1.63, went up to $1.64 and hit $1.52 at 10:01 and $1.51 at 10:29 and $1.44 at 12:04. Thereafter price recovered to the ~$1.51/4 area by ~12:35 and held flattish[/] there through ~14:18 on little volume. Then it was down,flattish and recover 14:20-15:07, flattish through ~15:24, and all downhill from there to close at $1.46.
There were 8 pre-market trades, including three odd-lots totaling 170 shares for $1.62, that traded $1.61/2 totaling 670 shares.
The day opened with a buy of 11,016 shares for $1.63 and traded $1.60-$1.64 that minute followed initially by generally low volume $1.58/60 through 9:39, but for 350 shares at 9:38 doing $1.57. Then 9:40 saw ~900 shares do $1.60/3 followed by a two-minute ~14.3K $1.62->$1.58->$1.59 move. Low/no-volume followed and the period ended at 9:58 for $1.59. 10:00-10:18, after three minutes no trades, did ~11.4K $$1.59->$1.55 to begin a series of low/medium-volume erratic steps lower, hitting $1.52 at 10:01. Low-volume $1.53/4 followed until 10:06 did ~27.3K $1.54/5, 8.3K the next minute $1.54/7, and next minute $1.54/5 to start no/low-volume $1.54/6, which expanded to $1.54/7 at 10:15, and ended at $1.56. 10:19-11:02, after thre minutes no trades, began a low-volume slide lower, hitting $1.51 at 10:29 on ~7.2K shares. Range immediately recovered to $1.54 but no trades went off again until 10:36 to start no/low-volume $1.55/6, went $1.53/5 at 10:41, had no trades 10:42-10:47, and ended at $1.56. 11:03-11:50 started a brief no/low-volume move up with 200 shares for $1.57 and hit $1.55/8 on 3.4K at 11:07 and began no/low-volume $1.57/$1.58, went $1.56/8 at 11:38, $1.56/7 at 11:46, and ended there. 11:51-12:05, after no trades for five minutes, did ~64.6K $1.57->$1.53->$1.62->$1,54, did low/no-volume $1.53/4 a couple minutes, at 12:04 did ~62.9K $1.53->$1.44, and did ~1.8K back to $1.48 to end the period. 12:06-14:10 did 1.2K to $1.50 and began no/low-volume $1.49/50, began a low-volume climb at 12:16 to level out at $1.52/4 at 12:21 and trade there to end at $1.53. 14:11-15:21, after no trades for eight minutes, dropped to $1.52 on 400 shares, back to $1.53 two minutes later on 340 shares, did a two-minute ~12.9K $1.53->$1.49, and began no/low-volume $1.50/1, went to 1.50/2 at 14:40, 15:07 $1.51/3 and ended at $1.53. 15:22-15:33, after two minutes no trades, began with 12.1K $1.51->$1.53->$1.49->$1.50 and began no/low-volume $1.49/50, ending there. 15:34-15:54 began with ~11.8K $1.49->$1.48 and went low-volume there, interrupted at 15:46 by a ~5.2K minute of $1.50/2, and ended at $1.49. 15:55-16:00 began with an 800-share drop to $1.47/8, traded $1.49 next three minutes, $1.46/50 at 15:59 on ~15K, and ended the period and day with a 261-share, plus some odd lots, sell for $1.46.
There were no AH trades.
Including the opening trade (closing didn't qualify), there were 15 larger trades (>=5K & 2 4K+) totaling 125,313, 28.53% of day's volume, with a $1.5387 VWAP. Excluding the opening trade, there were 14 larger trades totaling 114,297, 26.02% of day's volume, with a $1.5299 VWAP.
In the breakdown below note the 11:51-12:05 period. That period was 130,004 shares, 125.67% of the day's volume before the period began (163,380), thanks to the 11:56 and 12:04 6xK minutes (~127.5K combined), both of which moved trading range: from $1.57 up to $1.62 down to $1.53 up to $1.54 in the first large-volume minute; from $1.53 to $1.44 in the next large-volume minute. Note the buy percentage remained relatively constant, compared to the prior period, but VWAP had a big change compared to the prior period.
The behavior during these two large-volume minutes were quite different. The first period had a very high volume of trades taking out the offers, which drove the price up a large amount, having a VWAP of $1.5926. The second large-volume minute had a large number hitting the bids, which had initially moved up during the first high-volume minute, and had a VWAP of $1.4761.
With the volumes so similar it's understandable that buy percentage changed little. Further, we can surmise an aggregate VWAP of 1.5344, quite close to the period overall, telling us that other trades were a minuscule volume.
Note the larger block trade prices and sizes and times for the period as well. Note the buy percentages prior to and subsequent to the period.
All this makes me think these may have been market-maker or broker operations to cover some shorts from yesterday when our VWAP was $1.5688. A $1.5344 VWAP cover price (and remember, that's just the 12:05 period) would be nice one-day gain added to the fees MMs get from the exchanges for providing liquidity. OTOH, look at the VWAPs from the periods prior to that ending at 12:05. If MMs or brokers were shorting into those higher VWAPs, which comprised ~37% of day's volume, the 12:05 period could have been covering of today's shorts, also yielding a nice profit.
Other possibilities occur to me. Large holder(s) exiting their position, $CPST again utilizing the ATM facility, or momo and day traders taking profits. Everything is on the table as these elevated prices had not been seen since since 1/6, a high-volume (~1.3MM shares) high price ($1.41-$1.63) day. We know from a quarterly report analysis that $CPST had been hitting the ATM hard, to the tune of ~17% dilution.
Which it is will never be known. Ending Period Period Period Per. Trade_ Period_ % Day_ Per. End
Period Volume Low High Dollar Val. VWAP___ Volume Buy ~%
09:28 500 $1.6100 $1.6200 $806.00 $1.6120 0.11% 100.00%
09:58 71202 $1.5375 $1.6400 $113,715.33 $1.5971 16.21% 50.61% Incl 09:30 $1.6300 11,016 09:52 $1.5500 4,000
10:18 48259 $1.5200 $1.5700 $74,720.03 $1.5483 10.99% 34.28% Incl 10:06 $1.5500 10,580
11:02 19494 $1.5100 $1.5700 $30,006.36 $1.5393 4.44% 34.88%
11:50 23925 $1.5500 $1.5800 $37,541.46 $1.5691 5.45% 40.51% Incl 11:37 $1.5700 8,280
12:05 130004 $1.4400 $1.6200 $199,432.16 $1.5340 29.60% 40.98% Incl 11:56 $1.6200 12,200 7,900
12:04 $1.5000 10,000 10,000 $1.4500 11,100
14:10 25497 $1.4900 $1.5400 $38,936.01 $1.5271 5.81% 36.27% Incl 12:46 $1.5399 5,750
15:21 28790 $1.4900 $1.5300 $43,477.97 $1.5102 6.56% 36.66% Incl 14:23 $1.5100 7,000
15:33 21357 $1.4900 $1.5300 $32,117.93 $1.5039 4.86% 37.69% Incl 15:24 $1.5200 4,700 15:33 $1.4900 5,000
15:54 48872 $1.4800 $1.5200 $73,045.23 $1.4946 11.13% 39.22% Incl 15:34 $1.4900 9,050 15:52 $1.5000 8,737
16:00 17670 $1.4600 $1.5000 $26,158.85 $1.4804 4.02% 39.85%
On the traditional TA front, movements were: __Open_ ___Low_ __High_ _Close_ Volume_
Today 15.60% 2.86% -2.96% -7.59% -50.01%
Prior 6.82% 12.00% 28.03% 23.44% 238.44%
It's time for a new minimal chart I guess.

Note we have an apparent medium-term sideways channel (horizontal red lines) possible combined with a short-term rising channel (bottom-most rising blue lines) developing. All have sufficient touches to be considered valid. The sideways channel has resistance at $1.63/5 and support at $1.15/6.
Note that yesterday, the day following the quarterly report, we penetrated above, but couldn't sustain above, the sideways channel resistance. Moreover, today we opened at/below it, moved up a wee bit and quickly fell back, and closed, well below it. Similarly, yesterday penetrated above the rising short-term resistance. Close managed to remain barely above it though and today even though we opened above the short-term rising resistance we quickly fell below that too and closed below it.
Since this was on falling volume we might be inclined to think there's no strength in the down move. Not so say I!
Yesterday was exceptional volume, the highest since 1/6's ~1.3MM. It's natural that volume would be lower unless a strong push up were manifest, which is not the case. Further, the 10-day average volume before the day of the report was ~243K and after yesterday's ~879K was still only ~320K. So today's ~439K was still high volume from any perspective but yesterday's volume.
Given that, I believe the price and volume combination is telling us there is more downside to go and certainly is not indicating any upside.
BTW, today was a Friday too. It's very common for Fridays to be low volume and flat - neither of which was the case today. Add that to the possible negative connotations.
On my one-year chart the 10 and 20-day SMAs continue to rise. They are at $1.3470 and $1.2770 respectively ($1.3280 and $1.2670 yesterday). The 50-day SMA is still falling, at $1.3610 ($1.3686 yesterday).
All the oscillators I watch, but for full stochastic, weakened but are still above neutral. Full stochastic moved above neutral. This is a significant reversal as yesterday all were strengthening.
The 13-period Bollinger limits, $1.0477 and $1.5615 ($1.0095 and $1.5412 yesterday) continue rising and are narrowing slightly as the lower limit rises slightly faster. The mid-point is rising giving some hope, albeit not much based on history, that it will rise to meet price rather than price falling to the mid-point, or even below. I expect price will fall.
All in, keep in mind my admonition yesterday about a few days needed to determine what the new trend will be. If today is the start it's earlier than I expected and that's not good I think. But today was Friday.
Percentages for daily short sales and buys moved in opposite directions but with the short percentage moving so little I think we should discount this. The buy percentage dropping so soon after the quarterly report doesn't bode well.
The spread narrowed but is still quite wide. We can't say yet that we are in a down trend, but I expect that is the case developing and this spread seems negative in that regard. This is more so due to the way it was produced - a very high early price action that dropped radically during the day and closed very low. Combined with a VWAP drop, certainly not a good sign.
All in, this is looking negative to me.
As always, much is experimental and should be treated as such.
Bill
 News
News  Market Data
  Discover


