 News
News  Market Data
  Discover

Support: 888-992-3836
Copyright © 2023 InvestorsHub Inc.


Replies to post #76010 on Triple 000 and Sub-penny Chart Plays


CTLE - Nano Labs Corporate Update to Shareholders
1 hour 1 minute ago - DJNF
Nano Labs Corporate Update to Shareholders
DETROIT, MI--(Marketwired - Oct 16, 2015) - Nano Labs Corp. (OTC PINK: CTLE). The company would like to report the following update to shareholders regarding corporate developments over the past two weeks.
Dear Shareholders,
We would like to inform our shareholders that the Company received written notice October 6(th) , 2015 from the US Securities and Exchange Commission that the Commission has taken action to suspend our current auditor's privilege of appearing or practicing before the Commission. You can find a copy of the Commission's action on the SEC's website at www.sec.gov/litigation/admin/2015/33-9915.pdf.
Effective May 7, 2015, the Company's certifying accountant, Terry L. Johnson, CPA ("Johnson"), was dismissed as the Company's independent registered public accounting firm. The reason for the dismissal by the Company of Johnson was based on the fact that the Securities and Exchange Commission took action to suspend Johnson from appearing or practicing before the Securities and Exchange Commission and from practicing as an accountant on behalf of any publicly traded company or other entity regulated by the Securities and Exchange Commission. Therefore, the Company is not allowed to include Johnson's audit report for fiscal year ended June 30, 2014 in the Company's Annual Report on Form 10-K for fiscal year ended June 30, 2015. The Company would need to re-audit fiscal year ended June 30, 2014 and year ending June 30, 2013.
The Company previously announced that it had engaged Malone Bailey LLP ("MB") as its principal independent registered public accounting firm effective May 7, 2015. The decision to change its principal independent registered public accounting firm was approved by the Company's board of directors.
The Company's Board of Directors has subsequently determined that the suspension of Johnson and the necessity of re-auditing the financial statements for fiscal year ended June 30, 2014 and fiscal year ending June 30, 2013 has caused disastrous economic and financial consequences for the Company. It has also presented insurmountable issues in obtaining working papers and financial data from Johnson pertaining to its prior financial statements for fiscal year ended June 30, 2014 as prepared by Johnson, which are being requested by the Company's current auditors. Therefore, the Board of Directors has determined that it is in the best interests of the Company and its shareholders to de-register its securities and cease becoming a fully reporting company under the Securities Exchange Act of 1934, as amended.
The Board of Directors has determined that it will proceed with the requirements for listing as a pink sheet company with the OTC Markets while working to correct the accounting issues in order to comply with United States Security Exchange Commissions reporting requirements.
Pol-Ec International Corp
The company would like to inform our shareholders that the company remains focused on completing and starting production by the end of November of 2015. We have leased the location located in Ciudad Sahagun in Hidalgo State and received the equipment to commence production; the first production line will produce 3,000 pieces per day of pavers and cinder blocks for the local market in Mexico City and Mexico State. This plant will produce precast construction materials by recycling and using materials considered as industrial waste currently on site to manufacture prefabricated decorative high value added building materials using industrial waste such as mining tailings, smelting dross, slags and sludge that today are being stored or contained.
Pol-Ec International has presented this new technology to the International Marble Institute and also demonstrated these new results at the International Stone Summit, the Marmomacc conference in Verona, Italy on September 30th to October 3rd, 2015. Pol-Ec International is currently pursuing new opportunities as a result of these presentations to commercialize this tremendous potential for precast construction pieces to be made in a very cost-effective way and representing an irreplaceable alternative to recycling and using pollutant waste materials, turning them into pieces of high aesthetic and commercial value.
We are dealing with this unforeseen accounting set back; we will deal with it and continue to pursue our business development regarding our opportunities with the New Mexico City Airport, monstrous road and highway infrastructure applications, and the major retail markets for our product.
We would like to thank our shareholders for their continuing support as we move forward to commercialization of our technologies.
Sincerely,
Mr. Bernardo Camacho Chavarria
President of Nano Labs

May 11, 2015
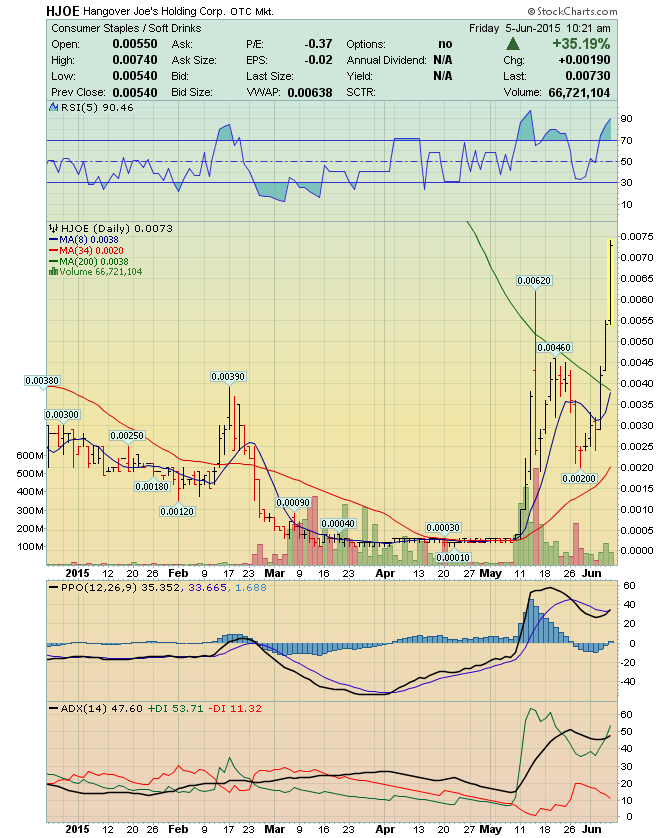
Hangover Joe's Holding Corporation (HJOE) had quite a week.
On Monday May 11, 2015,
the company's stock opened at $0.0004 and closed at $0.001;
on Thursday, it hit a heady intraday high of $0.0062
on 532 million shares, only to fall back to close at $0.0024
The increased interest in the issue
seemingly came out of nowhere.
Only a little less than three weeks ago,
HJOE was trading in the low triple zeros
on average volume not much greater
than 10 million shares daily.
What on earth had happened ?
Toxic financing
The quarterly makes clear that HJOE's financial condition
much to be desired.
At the end of September,
the company had a working capital deficiency of $2.704 million, and an accumulated deficit of $6.284 million.
It reported a net loss of approximately $592,000 for the period, and relied on debt financing and private placements of its common stock to fund operations.
Due to a lack of liquidity--another word for money--
it had defaulted on some of its debt agreements and a licensing agreement struck with Warner Brothers for use of promotional materials having to do with the movie The Hangover.
The sales of convertible notes are particularly troubling.
HJOE is in hock to nearly every major toxic funder out there,
and to some minor ones as well. Though most of the individual loans are relatively small, as of early 2015, more than $700,000 in convertible notes was outstanding, and additional financing was needed. Some, but not nearly all, of that debt has been converted, but more has been incurred.
The gigantic increase in the authorized
was obviously necessary to accommodate conversions.
On February 23, 2015
HJOE followed through by amending its articles of incorporation in Colorado to reflect the change.
The raise in authorized capital came just in the nick of time.
On March 20, 2015,
a new lender, Joshua Sason's Magna Asset Services, Ltd.,
entered the picture.
In his Schedule 13G,
Sason indicated that he potentially controlled 9.99%
of the company's common stock,
and reported that the current shares outstanding were 1,747,702,984
The outstanding had grown
by a little more than 1.4 billion shares
between the beginning of December and the end of March.
That is dilution on a staggering scale.
(Note that Magna, as a new lender,
hasn't converted his note yet.
His position "consists of Common Stock that the reporting person has the right to acquire by way of conversion of promissory note(s)." Typically, note holders don't convert until their stock can be issued free trading.)
May 11, 2015
Hangover Joe's Holding Corporation (HJOE) had quite a week.
On Monday May 11, 2015,
the company's stock opened at $0.0004 and closed at $0.001;
on Thursday, it hit a heady intraday high of $0.0062
on 532 million shares, only to fall back to close at $0.0024
The increased interest in the issue
seemingly came out of nowhere.
Only a little less than three weeks ago,
HJOE was trading in the low triple zeros
on average volume not much greater
than 10 million shares daily.
What on earth had happened ?
MARKET MAKER SIGNALS
Penny traders believe that Market Makers (MM)
will "signal" moves in advance buy using
small amounts of buys or sells as "signals".
The "signals" are such a small amount of shares
(worth no more than 5 or 10 dollars) that
no trader would have paid a commission that
costs more than the amount of shares bought.
The "signals" are from one MM to another.
100 - I need shares.
200 - I need shares badly, but do not take the stock down.
300 - Take the price down so I can load shares
400 - Keep trading it sideways.
500 - Gap the stock.
This gap can be either up or down,
depending on the direction of the 500 signal.
911 - Pending News


Pol-Ec International Corp
The company would like to inform our shareholders
that the company remains focused on,
completing and starting production
by the end of November of 2015.
...we will continue to pursue our business development
regarding our opportunities,
with the New Mexico City Airport,
monstrous road and highway infrastructure applications,
and the major retail markets, for our product.
We would like to thank our shareholders
for their continuing support
as we move forward to commercialization of our technologies.
Sincerely,
Mr. Bernardo Camacho Chavarria
President of Nano Labs
Nano Labs has signed an agreement to produce
Pol-Ec Tecnosoil.
The Tecnosoil when applied to sand, earth or clay, turns the surface to durable cement.
| Volume | |
| Day Range: | |
| Bid Price | |
| Ask Price | |
| Last Trade Time: |


