InvestorsHub Logo
icon url

trader53

09/23/15 5:48 AM

#74937 RE: EZmoney- #74893

RMRK "Forced Short Squeeze" Targets: 0.0005 / 0.0006


RMRK - to Reverse Split upon approval by FINRA

* Shareholders may be able to "Force a Short Squeeze" !

RMRK - to effect a 1-for-1,000 Reverse Split

Company filed a Certificate of Amendment
on September 17, 2015


FORM 8-K
Date of Report: August 31, 2015

The Company was unable to pay the BML fees payable
to the State of Nevada due on August 31, 2015,
and we're therefore required to relinquish the interest
in the Silver Cloud Property to the Pescio family.

Item 5.03 Amendments to Articles of Incorporation or Bylaws; Change in Fiscal Year.

On September 17, 2015, filed a Certificate of Amendment (the “Certificate”)
with the Secretary of State of the State of Nevada
to effect a reverse stock split of its authorized
and outstanding shares of common stock
at a ratio of 1 for 1,000
(the “Stock Split”).

The Stock Split was previously approved
by the board of directors of the Company.

The Stock Split will become effective
upon receipt of the necessary documentation
regarding the Stock Split
and approval by the Financial Industry Regulatory Authority ("FINRA").

Upon the effectiveness of the Stock Split,
the Company’s issued and outstanding shares of common stock
will decrease from approximately 1.99 billion shares
to approximately 1.99 million shares of common stock,
par value of $0.001 per share.


http://ih.advfn.com/p.php?pid=nmona&article=68608819&symbol=RMRK

http://archive.fast-edgar.com//20150922/AFZDN22CZC22KTZZ2A2A2ZZZMNPBZ6R7Z272/

http://www.allotcbb.com/quote.php?symbol=RMRK

http://thestockmarketwatch.com/stock/?stock=RMRK

* Embedded Chart


Live! Charts

http://stockcharts.com/h-sc/ui?s=RMRK&p=D&yr=0&mn=4&dy=0&id=p04766525985


icon url

trader53

09/23/15 8:28 AM

#74939 RE: EZmoney- #74893

RMRK Short Squeeze - What it is:

http://investorshub.advfn.com/boards/read_msg.aspx?message_id=113157377

http://www.investinganswers.com/financial-dictionary/real-estate/short-squeeze-2045


Follow your stocks Short Position


A Short Squeeze is a situation in which
a stock's price increase triggers a rush of buying activity
among short sellers
.


A "Short Squeeze" occurs,
when the stock's price doesn't decline as anticipated.

Short sellers must buy stock
to close out their short positions
and cut their losses,
which results in a further increase in stock prices,
which compel still more short sellers
to cover their positions.

* Embedded Chart


Live! Charts

http://stockcharts.com/h-sc/ui?s=RMRK&p=D&yr=0&mn=4&dy=0&id=p04766525985


icon url

trader53

09/23/15 10:36 AM

#74944 RE: EZmoney- #74893

CTLE - Wave 3 Targets


CTLE - is at the very beginning of Wave 3

CTLE - Are you ready to Surf Wave 3 ?
http://investorshub.advfn.com/boards/read_msg.aspx?message_id=117184960


CTLE - Wave 3 Targets: 0.003 / 0.0042 / 0.0054 / 0.006


icon url

trader53

09/24/15 4:59 AM

#74989 RE: EZmoney- #74893

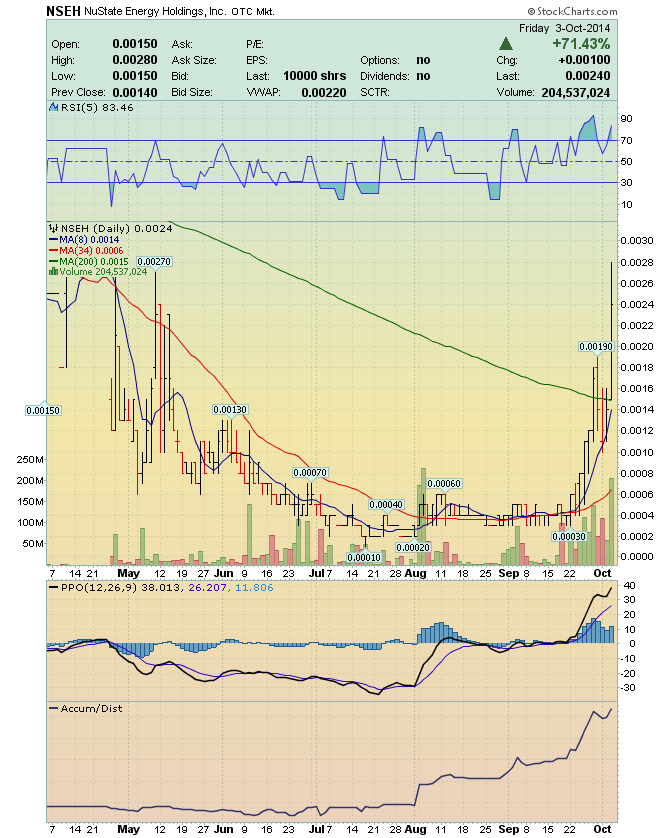
NSEH The Elliott Wave 5-Waves Up Sequence

Elliott Wave Basics
http://investorshub.advfn.com/boards/read_msg.aspx?message_id=113103065

Elliott Wave Principle
http://www.forexhit.com/learn-forex/elliott-wave-principle.html

Elliott Wave Theory
http://ta.mql4.com/elliott_wave_theory


Buy after an Elliott Wave,
5-Wave decline sequence !


A Basic "A,B,C Corrective Wave"
http://investorshub.advfn.com/boards/read_msg.aspx?message_id=113102933

Buy, ONLY when the stocks price,
is trading under the Blue 8-day M.A.
when the Blue 8-day M.A. is under the Red 34-day M.A.

http://investorshub.advfn.com/boards/read_msg.aspx?message_id=86382765


Impulse Wave 1 - The Accumulation Stage

"Wave One"
is the Wave right after a prolonged downtrend.


This stock has been going down,
but now it is starting to trade sideways,
forming a base.

The sellers who once had the upper hand,
are now beginning to lose their power,
because the buyers are starting to get more aggressive.

The stock just drifts sideways without a clear trend.

Everyone hates this stock!
This is the time to be Loading the Boat !!


http://investorshub.advfn.com/boards/read_msg.aspx?message_id=81775516


Buy after an Elliott Wave,
5-Wave decline sequence !


A Basic "A,B,C Corrective Wave"
http://investorshub.advfn.com/boards/read_msg.aspx?message_id=113102933

Buy, ONLY when the stocks price,
is trading under the Blue 8-day M.A.
when the Blue 8-day M.A. is under the Red 34-day M.A.

http://investorshub.advfn.com/boards/read_msg.aspx?message_id=86382765


Elliott Wave Basics
http://stockcharts.com/school/doku.php?id=chart_school:market_analysis:elliott_wave_theory

Basic Sequence

The chart below shows a rising 5-Wave sequence.

The entire Wave is up as it moves from the lower left
to the upper right of the chart.


Waves 1,3 and 5 are impulse waves
because they move with the trend.


Waves 2 and 4 are corrective waves
because they move against this bigger trend.


A basic impulse advance forms a 5-Wave sequence.


Impulse Wave 1 - The Accumulation Stage

"Wave One"
is the Wave right after a prolonged downtrend.


This stock has been going down,
but now it is starting to trade sideways,
forming a base.

The sellers who once had the upper hand,
are now beginning to lose their power,
because the buyers are starting to get more aggressive.

The stock just drifts sideways without a clear trend.

Everyone hates this stock!
This is the time to be Loading the Boat !!


http://investorshub.advfn.com/boards/read_msg.aspx?message_id=81775516


Wave 1 - Stock Climbs, from 0.0001 to 0.0006

The stock makes its initial move upwards.
This is usually caused
by a relatively small number of people
that all of the sudden
(for a variety of reasons, real or imagined)
feel that the price of the stock is cheap
so it’s a perfect time to buy.
This causes the price to rise.


Wave 2 - Stock Declines, from 0.0006 to 0.0003

At this point,
enough people who were in the original wave
consider the stock overvalued and take profits.
This causes the stock to go down.
However, the stock will not make it to its previous lows
before the stock is considered a bargain again.


Wave 3 - Stock Climbs, from 0.0003 to 0.0019

This is usually the longest and strongest wave.
The stock has caught the attention of the mass public.
More people find out about the stock and want to buy it.
This causes the stock’s price to go higher and higher.
This wave usually exceeds the high created at the end of Wave 1.


Wave 4 - Stock Declines, from 0.0019 to 0.001

Traders take profits
because the stock is considered expensive again.

This Wave tends to be weak
because there are usually more people
that are still bullish on the stock
and are waiting to “buy on the dips.”


Wave 5 - Stock Climbs, from 0.001 to 0.0028

This is the point that most people get in on the stock,
and is mostly driven by hysteria.

You usually start seeing the CEO of the company
on the front page of major magazines
as the Person of the Year.
Traders and investors start coming up with
ridiculous reasons to buy the stock
and try to choke you when you disagree with them.

This is when the stock becomes the most overpriced.
Contrarians start shorting the stock
which starts the ABC pattern.


icon url

trader53

09/24/15 4:35 PM

#75004 RE: EZmoney- #74893

CTLE The Elliott Wave 5-Waves Up Sequence

* Embedded and Live! Charts
(See Live! Charts at Bottom of post)

Elliott Wave Basics
http://investorshub.advfn.com/boards/read_msg.aspx?message_id=113103065

Elliott Wave Principle
http://www.forexhit.com/learn-forex/elliott-wave-principle.html

Elliott Wave Theory
http://ta.mql4.com/elliott_wave_theory


Buy after an Elliott Wave,
5-Wave decline sequence !


A Basic "A,B,C Corrective Wave"
http://investorshub.advfn.com/boards/read_msg.aspx?message_id=113102933

Buy, ONLY when the stocks price,
is trading under the Blue 8-day M.A.
when the Blue 8-day M.A. is under the Red 34-day M.A.

http://investorshub.advfn.com/boards/read_msg.aspx?message_id=86382765


Impulse Wave 1 - The Accumulation Stage

"Wave One"
is the Wave right after a prolonged downtrend.


This stock has been going down,
but now it is starting to trade sideways,
forming a base.

The sellers who once had the upper hand,
are now beginning to lose their power,
because the buyers are starting to get more aggressive.

The stock just drifts sideways without a clear trend.

Everyone hates this stock!
This is the time to be Loading the Boat !!


http://investorshub.advfn.com/boards/read_msg.aspx?message_id=81775516


Buy after an Elliott Wave,
5-Wave decline sequence !


A Basic "A,B,C Corrective Wave"
http://investorshub.advfn.com/boards/read_msg.aspx?message_id=113102933

Buy, ONLY when the stocks price,
is trading under the Blue 8-day M.A.
when the Blue 8-day M.A. is under the Red 34-day M.A.

http://investorshub.advfn.com/boards/read_msg.aspx?message_id=86382765


Buy after an Elliott Wave,
5-Wave decline sequence !


A Basic "A,B,C Corrective Wave"
http://investorshub.advfn.com/boards/read_msg.aspx?message_id=113102933

Buy, ONLY when the stocks price,
is trading under the Blue 8-day M.A.
when the Blue 8-day M.A. is under the Red 34-day M.A.

http://investorshub.advfn.com/boards/read_msg.aspx?message_id=86382765


Elliott Wave Basics
http://stockcharts.com/school/doku.php?id=chart_school:market_analysis:elliott_wave_theory

Basic Sequence

The chart below shows a rising 5-Wave sequence.

The entire Wave is up as it moves from the lower left
to the upper right of the chart.


Waves 1,3 and 5 are impulse waves
because they move with the trend.


Waves 2 and 4 are corrective waves
because they move against this bigger trend.


A basic impulse advance forms a 5-Wave sequence.


Impulse Wave 1 - The Accumulation Stage

"Wave One"
is the Wave right after a prolonged downtrend.


This stock has been going down,
but now it is starting to trade sideways,
forming a base.

The sellers who once had the upper hand,
are now beginning to lose their power,
because the buyers are starting to get more aggressive.

The stock just drifts sideways without a clear trend.

Everyone hates this stock!
This is the time to be Loading the Boat !!


http://investorshub.advfn.com/boards/read_msg.aspx?message_id=81775516


Wave 1 - Stock Climbs, from 0.0001 to 0.0006

The stock makes its initial move upwards.
This is usually caused
by a relatively small number of people
that all of the sudden
(for a variety of reasons, real or imagined)
feel that the price of the stock is cheap
so it’s a perfect time to buy.
This causes the price to rise.


Wave 2 - Stock Declines, from 0.0006 to 0.0002

At this point,
enough people who were in the original wave
consider the stock overvalued and take profits.
This causes the stock to go down.
However, the stock will not make it to its previous lows
before the stock is considered a bargain again.


Wave 3

This is usually the longest and strongest wave.
The stock has caught the attention of the mass public.
More people find out about the stock and want to buy it.
This causes the stock’s price to go higher and higher.
This wave usually exceeds the high created at the end of Wave 1.


Wave 4

Traders take profits
because the stock is considered expensive again.

This Wave tends to be weak
because there are usually more people
that are still bullish on the stock
and are waiting to “buy on the dips.”


Wave 5

This is the point that most people get in on the stock,
and is mostly driven by hysteria.

You usually start seeing the CEO of the company
on the front page of major magazines
as the Person of the Year.
Traders and investors start coming up with
ridiculous reasons to buy the stock
and try to choke you when you disagree with them.

This is when the stock becomes the most overpriced.
Contrarians start shorting the stock
which starts the ABC pattern.


http://stockcharts.com/h-sc/ui?s=CTLE&p=D&yr=0&mn=3&dy=15&id=p50490303947


icon url

trader53

09/25/15 9:13 AM

#75021 RE: EZmoney- #74893

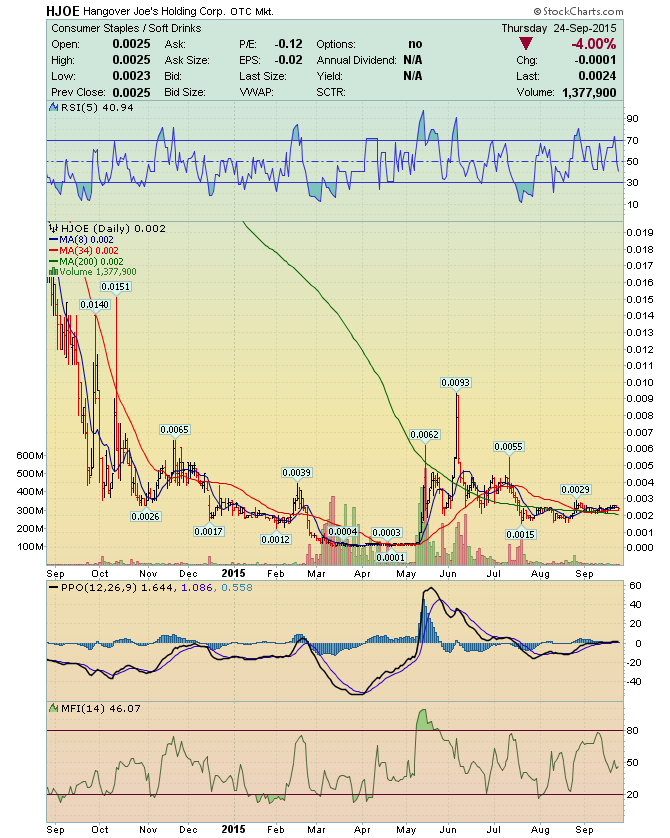
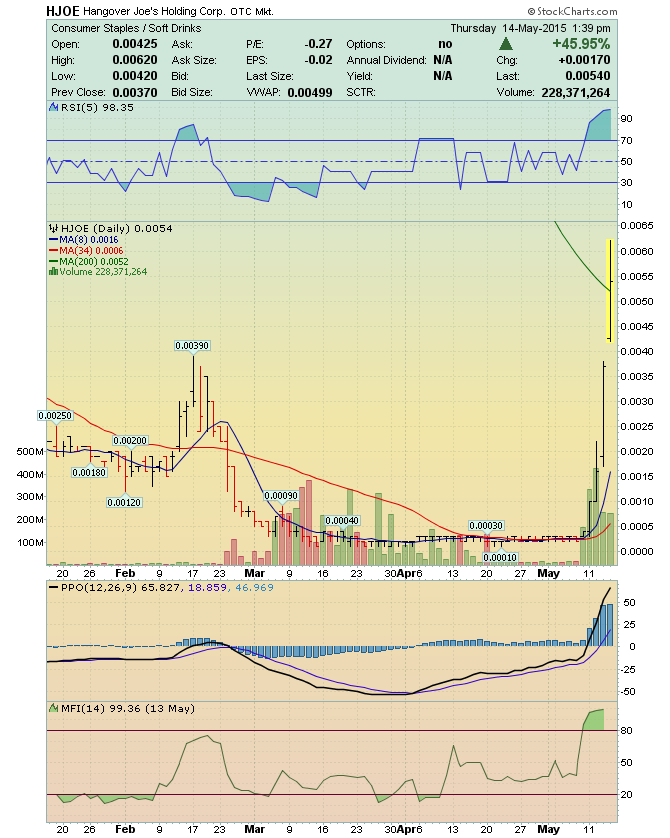
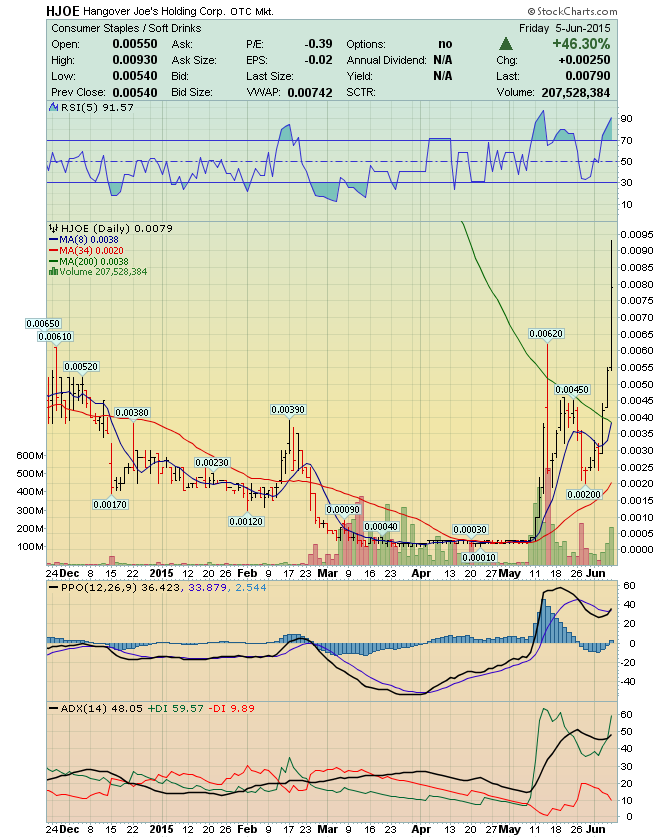
HJOE - The Elliott Wave 5-Waves Sequence

* Embedded and Live! Charts
(See Live! Charts at Bottom of post)


Elliott Wave Basics
http://investorshub.advfn.com/boards/read_msg.aspx?message_id=113103065

Elliott Wave Principle
http://www.forexhit.com/learn-forex/elliott-wave-principle.html

Elliott Wave Theory
http://ta.mql4.com/elliott_wave_theory

Buy after an Elliott Wave,
5-Wave decline sequence !


A Basic "A,B,C Corrective Wave"
http://investorshub.advfn.com/boards/read_msg.aspx?message_id=113102933

Buy, ONLY when the stocks price,
is trading under the Blue 8-day M.A.
when the Blue 8-day M.A. is under the Red 34-day M.A.

http://investorshub.advfn.com/boards/read_msg.aspx?message_id=86382765


This stock has been going down,
and starts to trade sideways,
forming a base.

The sellers who once had the upper hand,
begin to lose their power,
because the buyers are starting to get more aggressive.

The stock just drifts sideways without a clear trend.

Everyone hates this stock!
This is the time to be Loading the Boat !!


http://investorshub.advfn.com/boards/read_msg.aspx?message_id=81775516


Impulse Wave 1 - The Accumulation Stage
the Wave right after a prolonged downtrend.


Wave 1 - Stock Climbs, from 0.0001 to 0.0003

The stock makes its initial move upwards.
This is usually caused
by a relatively small number of people
that all of the sudden
(for a variety of reasons, real or imagined)
feel that the price of the stock is cheap
so it’s a perfect time to buy.
This causes the price to rise.


Wave 2 - Stock Declines, from 0.0003 to 0.0002

At this point,
enough people who were in the original wave
consider the stock overvalued and take profits.
This causes the stock to go down.
However, the stock will not make it to its previous lows
before the stock is considered a bargain again.


Wave 3 - Stock Climbs, from 0.0002 to 0.0022

This is usually the longest and strongest wave.
The stock has caught the attention of the mass public.
More people find out about the stock and want to buy it.
This causes the stock’s price to go higher and higher.
This wave usually exceeds the high created at the end of Wave 1.


Wave 4 - Stock Declines, from 0.0022 to 0.0017

Traders take profits
because the stock is considered expensive again
.

This Wave tends to be weak
because there are usually more people
that are still bullish on the stock
and are waiting to “buy on the dips.”


Wave 5 - Stock Climbs, from 0.0017 to 0.0062

This is the point that most people get in on the stock,
and is mostly driven by hysteria.

You usually start seeing the CEO of the company
on the front page of major magazines
as the Person of the Year.
Traders and investors start coming up with
ridiculous reasons to buy the stock
and try to choke you when you disagree with them.

This is when the stock becomes the most overpriced.
Contrarians start shorting the stock
which starts the ABC pattern.


Elliott Wave Basics
http://stockcharts.com/school/doku.php?id=chart_school:market_analysis:elliott_wave_theory

Basic Sequence

The chart below shows a rising 5-Wave sequence.

The entire Wave is up as it moves from the lower left
to the upper right of the chart.


Waves 1,3 and 5 are impulse waves
because they move with the trend.


Waves 2 and 4 are corrective waves
because they move against this bigger trend.


A basic impulse advance forms a 5-Wave sequence.


Wave 1

The stock makes its initial move upwards.
This is usually caused
by a relatively small number of people
that all of the sudden
(for a variety of reasons, real or imagined)
feel that the price of the stock is cheap
so it’s a perfect time to buy.
This causes the price to rise.

Wave 2

At this point,
enough people who were in the original wave
consider the stock overvalued and take profits.
This causes the stock to go down.
However, the stock will not make it to its previous lows
before the stock is considered a bargain again.

Wave 3

This is usually the longest and strongest wave.
The stock has caught the attention of the mass public.
More people find out about the stock and want to buy it.
This causes the stock’s price to go higher and higher.
This wave usually exceeds the high created at the end of Wave 1.

Wave 4

Traders take profits
because the stock is considered expensive again.
This Wave tends to be weak
because there are usually more people that are still bullish
on the stock and are waiting to “buy on the dips.”

Wave 5

This is the point that most people get in on the stock,
and is mostly driven by hysteria.

You usually start seeing the CEO of the company
on the front page of major magazines
as the Person of the Year.
Traders and investors start coming up with
ridiculous reasons to buy the stock
and try to choke you when you disagree with them.

This is when the stock becomes the most overpriced.
Contrarians start shorting the stock
which starts the ABC pattern.


Live! Charts

http://stockcharts.com/h-sc/ui?s=HJOE&p=D&yr=1&mn=1&dy=0&id=p99014066996

http://stockcharts.com/h-sc/ui?s=HJOE&p=D&yr=2&mn=1&dy=0&id=p00936656651


icon url

trader53

09/25/15 6:08 PM

#75037 RE: EZmoney- #74893

CTLE - All Next Week, is "Slap Happy" Week !


The Company 10-Q is due out around Sept. 29th


IR says,

they will be releasing a PR,

within the next 2-weeks !


The Press Release will contain all of the company News,
that they have been waiting to release since February.


icon url

trader53

09/26/15 2:55 PM

#75129 RE: EZmoney- #74893

Our Group: The Planned Trade


The Planned Trade: Our Winners!

http://investorshub.advfn.com/boards/read_msg.aspx?message_id=89492500


Our Groups Plan
to achieve "the Successful Trade"


Our Group,
will select a stock
and systematically
buy up the float and control the price objectives.

We will use our respective and collective sources,
of information, trading skills, list of followers,
to make the stock work for us.

We will demonstrate proficiency of trade
by picking winners !

We will ensure success
by using simple collaboration.

Our picks will become winners.


Traders will make money,
and we will create a public service benefit,

We will focus on stocks with "low floats",
that have "artificially depressed share prices".


We will force "Short cover squeezes".


Trader53


icon url

trader53

09/27/15 11:37 AM

#75249 RE: EZmoney- #74893

PVSP - The Elliott Wave 5-Waves Sequence

* Embedded and Live! Charts
(See Live! Charts at Bottom of post)


Elliott Wave Basics
http://investorshub.advfn.com/boards/read_msg.aspx?message_id=113103065

Elliott Wave Principle
http://www.forexhit.com/learn-forex/elliott-wave-principle.html

Elliott Wave Theory
http://ta.mql4.com/elliott_wave_theory

Buy after an Elliott Wave,
5-Wave decline sequence !


A Basic "A,B,C Corrective Wave"
http://investorshub.advfn.com/boards/read_msg.aspx?message_id=113102933

Buy, ONLY when the stocks price,
is trading under the Blue 8-day M.A.
when the Blue 8-day M.A. is under the Red 34-day M.A.

http://investorshub.advfn.com/boards/read_msg.aspx?message_id=86382765


This stock has been going down,
and starts to trade sideways,
forming a base.

The sellers who once had the upper hand,
begin to lose their power,
because the buyers are starting to get more aggressive.

The stock just drifts sideways without a clear trend.

Everyone hates this stock!
This is the time to be Loading the Boat !!


http://investorshub.advfn.com/boards/read_msg.aspx?message_id=81775516


Impulse Wave 1 - The Accumulation Stage
the Wave right after a prolonged downtrend.


Wave 1 - Stock Climbs, from 0.0001 to 0.0005

The stock makes its initial move upwards.
This is usually caused
by a relatively small number of people
that all of the sudden
(for a variety of reasons, real or imagined)
feel that the price of the stock is cheap
so it’s a perfect time to buy.
This causes the price to rise.


Wave 2 - Stock Declines, from 0.0005 to 0.0001

At this point,
enough people who were in the original wave
consider the stock overvalued and take profits.
This causes the stock to go down.
However, the stock will not make it to its previous lows
before the stock is considered a bargain again.


Wave 3 - Stock Climbs, from 0.0001 to 0.0028

This is usually the longest and strongest wave.
The stock has caught the attention of the mass public.
More people find out about the stock and want to buy it.
This causes the stock’s price to go higher and higher.
This wave usually exceeds the high created at the end of Wave 1.


Wave 4- Stock Declines, from 0.0028 to 0.0014

Traders take profits
because the stock is considered expensive again
.

This Wave tends to be weak
because there are usually more people
that are still bullish on the stock
and are waiting to “buy on the dips.”


Wave 5 - Stock Climbs, from 0.0014 to 0.0035

This is the point that most people get in on the stock,
and is mostly driven by hysteria.

You usually start seeing the CEO of the company
on the front page of major magazines
as the Person of the Year.
Traders and investors start coming up with
ridiculous reasons to buy the stock
and try to choke you when you disagree with them.

This is when the stock becomes the most overpriced.
Contrarians start shorting the stock
which starts the ABC pattern.


Elliott Wave Basics
http://stockcharts.com/school/doku.php?id=chart_school:market_analysis:elliott_wave_theory

Basic Sequence

The chart below shows a rising 5-Wave sequence.

The entire Wave is up as it moves from the lower left
to the upper right of the chart.


Waves 1,3 and 5 are impulse waves
because they move with the trend.


Waves 2 and 4 are corrective waves
because they move against this bigger trend.


A basic impulse advance forms a 5-Wave sequence.


Wave 1

The stock makes its initial move upwards.
This is usually caused
by a relatively small number of people
that all of the sudden
(for a variety of reasons, real or imagined)
feel that the price of the stock is cheap
so it’s a perfect time to buy.
This causes the price to rise.

Wave 2

At this point,
enough people who were in the original wave
consider the stock overvalued and take profits.
This causes the stock to go down.
However, the stock will not make it to its previous lows
before the stock is considered a bargain again.

Wave 3

This is usually the longest and strongest wave.
The stock has caught the attention of the mass public.
More people find out about the stock and want to buy it.
This causes the stock’s price to go higher and higher.
This wave usually exceeds the high created at the end of Wave 1.

Wave 4

Traders take profits
because the stock is considered expensive again.
This Wave tends to be weak
because there are usually more people that are still bullish
on the stock and are waiting to “buy on the dips.”

Wave 5

This is the point that most people get in on the stock,
and is mostly driven by hysteria.

You usually start seeing the CEO of the company
on the front page of major magazines
as the Person of the Year.
Traders and investors start coming up with
ridiculous reasons to buy the stock
and try to choke you when you disagree with them.

This is when the stock becomes the most overpriced.
Contrarians start shorting the stock
which starts the ABC pattern.


Live! Charts

http://stockcharts.com/h-sc/ui?s=PVSP&p=D&yr=2&mn=6&dy=0&id=p91569850849


icon url

trader53

09/27/15 9:49 PM

#75320 RE: EZmoney- #74893

CTLE - Ready when you are, Captain !


CTLE - May the "Force" be with you !!

http://investorshub.advfn.com/boards/read_msg.aspx?message_id=117292876


Let's take her up then, Mr. Spock !


icon url

trader53

09/30/15 6:41 AM

#75497 RE: EZmoney- #74893

icon url

trader53

10/02/15 3:41 PM

#75690 RE: EZmoney- #74893

CTLE - "Run" is Coming Next Week !!

for Friday October 2, 2015 at 3:30 pm


Bid | Size
0.0001 | 306,743,000

Ask | Size
0.0002 | 134,890,600


CTLE - IR Phone number

Phone:
647-979-3799


CTLE - Deals with Wal-Mart, Home Depot, Rona, Lowe's stores
http://investorshub.advfn.com/boards/read_msg.aspx?message_id=117212991

The "signals" are from one MM to another.

100 - I need shares.
200 - I need shares badly, but do not take the stock down.
300 - Take the price down so I can load shares
400 - Keep trading it sideways.
500 - Gap the stock.
This gap can be either up or down,
depending on the direction of the 500 signal.
911 - Pending News


Time & Sales
http://www.investorpoint.com/stock/CTLE-Nano+Labs+Corp/market-makers-level2/

$0.0002 10,000 OTO 15:12:45

$0.0001 4,506,409 OTO 15:12:02
$0.0001 9,000,000 OTO 15:12:01
$0.0001 9,000,000 OTO 15:12:00
$0.0001 9,000,000 OTO 15:11:54
$0.0002 615,000 OTO 13:39:15

$0.0002 3,000 OTO 13:36:57
$0.0001 3,000 OTO 13:30:27
$0.0002 999,999 OTO 13:06:25
$0.0002 850,000 OTO 12:45:21
$0.0002 10,000 OTO 12:02:51

$0.0001 7,000,000 OTO 11:57:05
$0.0001 9,000,000 OTO 11:57:04
$0.0001 9,000,000 OTO 11:57:03

$0.0002 666,666 OTO 11:51:00
$0.0002 10,000 OTO 10:03:15

$0.0001 1,000 OTO 10:02:08

$0.0002 100,000 OTO 09:31:30
$0.0002 216,000 OTO 09:30:08
$0.0002 100,000 OTO 09:30:05


CTLE - Chaikin Money Flow
Video

http://www.stockgoodies.com/cmf---chaikin-money-flow.html


CTLE - Accumulation Distribution Line
Video

http://www.stockgoodies.com/accumulation--distribution.html


icon url

trader53

10/12/15 10:19 AM

#75975 RE: EZmoney- #74893

BIEL - Alerted at 0.0003 - Climbs to 0.002

I'll Alert you of stocks to Buy,
before the Run happens !


From 0.0003 to 0.002, in just 3-weeks !


Alerted
September 18, 2015
BIEL - The Short Report: Most Shorted Tickers
http://investorshub.advfn.com/boards/read_msg.aspx?message_id=117071300&txt2find=biel

http://stockcharts.com/h-sc/ui?s=BIEL&p=D&yr=0&mn=6&dy=0&id=p24654870249


icon url

trader53

10/13/15 10:02 AM

#76022 RE: EZmoney- #74893

CTLE 0.0007's by Thursday !!!


icon url

trader53

10/13/15 10:06 AM

#76023 RE: EZmoney- #74893

CTLE 0.002 by Early Next Week !!!

icon url

trader53

10/13/15 10:16 AM

#76024 RE: EZmoney- #74893

CTLE - To Infinity, and Beyond !

CTLE - Targets 0.0011 / 0.002 / 0.0042


icon url

trader53

10/13/15 12:51 PM

#76029 RE: EZmoney- #74893

CTLE - Time & Sales at 12:45 pm

Buy Vol 24M vs Sell Vol 29M


Bid | Size
0.0001 | 352,671,500

Ask | Size
0.0002 | 10,034,300


CTLE - IR Phone number

Phone: 647-979-3799


CTLE - Deals with Wal-Mart, Home Depot, Rona, Lowe's stores
http://investorshub.advfn.com/boards/read_msg.aspx?message_id=117562268

MARKET MAKER SIGNALS

Penny traders believe that Market Makers (MM)
will "signal" moves in advance buy using
small amounts of buys or sells as "signals".

The "signals" are such a small amount of shares
(worth no more than 5 or 10 dollars) that
no trader would have paid a commission that
costs more than the amount of shares bought.

The "signals" are from one MM to another.

100 - I need shares.
200 - I need shares badly, but do not take the stock down.
300 - Take the price down so I can load shares
400 - Keep trading it sideways.
500 - Gap the stock.
This gap can be either up or down,
depending on the direction of the 500 signal.
911 - Pending News


Time & Sales
http://www.investorpoint.com/stock/CTLE-Nano+Labs+Corp/market-makers-level2/

Time & Sales

Price Size Mkt Time


$0.0002 495,000 OTO 12:23:09

$0.0002 5,000 OTO 12:22:40

$0.0002 1,000,000 OTO 12:04:51
$0.0002 50,000 OTO 12:00:24
$0.0002 120,000 OTO 11:50:25

$0.0002 2,500,000 OTO 11:50:21
$0.0002 1,640,671 OTO 11:50:11
$0.0002 2,550,000 OTO 11:50:01
$0.0002 3,225,000 OTO 11:49:58

$0.0002 999,999 OTO 11:49:51
$0.0002 66,210 OTO 11:48:54
$0.0002 955,769 OTO 11:48:45

$0.0002 3,495,000 OTO 11:48:43
$0.0002 1,031,978 OTO 11:48:38
$0.0002 3,000,000 OTO 11:48:34
$0.0002 1,630,000 OTO 11:48:28
$0.0002 8,370,000 OTO 11:48:22
$0.0002 7,070,000 OTO 11:47:52
$0.0002 1,200,000 OTO 11:47:52

$0.0003 10,000 OTO 11:16:35
$0.0002 150,000 OTO 11:14:28

$0.0003 7,500 OTO 11:12:20

$0.0003 10,000 OTO 11:01:18
$0.0002 102,500 OTO 10:59:22

$0.0003 7,500 OTO 10:46:59

$0.0003 8,000 OTO 09:37:55


CTLE - Chaikin Money Flow
Video

http://www.stockgoodies.com/cmf---chaikin-money-flow.html
http://stockcharts.com/h-sc/ui?s=CTLE&p=D&yr=0&mn=3&dy=0&id=p55517331404


CTLE - Accumulation Distribution Line
Video

http://www.stockgoodies.com/accumulation--distribution.html
http://stockcharts.com/h-sc/ui?s=CTLE&p=D&yr=0&mn=3&dy=0&id=p72245188107


CTLE - Average Directional Index or ADX
Video

http://www.stockgoodies.com/adx---average-directional-index.html
http://stockcharts.com/h-sc/ui?s=CTLE&p=D&yr=0&mn=3&dy=0&id=p70227493220


CTLE - Money Flow Index
Video

http://www.stockgoodies.com/mfi---money-flow-index.html
http://stockcharts.com/h-sc/ui?s=CTLE&p=D&yr=0&mn=3&dy=0&id=p03164550512


$SPX - Money Flow Index
Video

http://www.stockgoodies.com/mfi---money-flow-index.html
http://stockcharts.com/h-sc/ui?s=%24SPX&p=D&yr=0&mn=3&dy=0&id=p26585777684


icon url

trader53

10/14/15 4:24 AM

#76043 RE: EZmoney- #74893

CTLE Construction of the New Int'l Airport of Mexico City


CTLE - Targets 0.001 / 0.002 / 0.004 / 0.006 / 0.009 / 0.01

http://investorshub.advfn.com/boards/read_msg.aspx?message_id=117680214