Here you go: Remember bold is the idiot author who originally wrote about the fumbles and the red are my highlights. All in all the Pats average about 1.5 2 fumbles less per year than others. Whoopdedo
Why Those Statistics About The Patriots' Fumbles Are Mostly Junk
Statistics can say whatever you want it to, drolls the dull old axiom. But that tack has always placed the onus more on the numbers than on the ones manipulating them; more correctly, you might say, Statistics can say whatever you want it to when it's used irresponsibly or haphazardly. This is especially important to remember this Super Bowl week.
Over the last several days, a few articles from SharpFootballAnalysis.com have proliferated through the Ballghazi conspiracy channels, centering mainly on what it argues is a suspicious lack of fumbles by the Patriots. They were so popular, in fact, that the site crashed for much of Friday. The well-trafficked and well-tweeted blog posts even earned the author radio spots and articles in the Wall Street Journal and on Slate.
But statistics is hard, and this can lead to deception, either willful or otherwise. So let's walk through the curious inputs, outputs, interpretations, and statistical decisions that were made in the broadest of these posts, The New England Patriots Prevention Of Fumbles Is Nearly Impossible. (There are harsh critiques of subsequent posts floating around, for those interested.) And because analytics is involved, let's go Fire Joe Morgan-style for this one—bold font for the original article, standard for commentary. Let's get to it.
Yesterday I investigated whether or not the New England Patriots outperform expectations in bad weather.
Broadly, this is true, though we would argue that's a very liberal use of the word "investigated." To be frank, it was a fishy analysis. And when asked about it, the author actually admitted it used "very inexact data."
Warren Sharp @SharpFootball @StatsbyLopez I literally clicked on EVERY home game, and if the report mentioned moisture, I captured. Nothing more/less. I'd welcome more
Warren Sharp @SharpFootball Follow @StatsbyLopez accurate investigation on every single home game from 06 onward as to the exact in-game precip. Very inexact data available.
So we're off to a good start here.
Then I remembered this remarkable fact: The 2014 Patriots were just the 3rd team in the last 25 years to never have lost a fumble at home!
Some important information as we get this started: there's little, if any, skill in recovering fumbles (see work from Football Outsiders and Bill Barnwell, for example). Without context—in this case, the number of lost fumbles and data about where on the field they occurred—it is plausible that the Patriots simply got lucky and recovered a small number of fumbles at home.
In fact, we checked the boxscores, and they did just that, as the Patriots recovered all six of their fumbles at home during the regular season.
Of course, perhaps their players are just more well-versed in recovering deflated footballs.
The biggest difference between the Patriots and the other 2 teams who did it was that New England ran between 150 and 200 MORE plays this year than those teams did in the years they had zero home fumbles, making the Patriots stand alone in this unique statistic.
Here's where things get fun. First, the author goes to CAPS for the first time. Get ready for MORE caps later. And while we are talking unique anecdotes that mean next to nothing, here's another one:
The Vikings had TWO total fumbles in road games this year. That's ONE-THIRD of the Patriots total at home.
So ARE the Vikings even WORSE cheaters?
I looked at the last 5 years of data (since 2010) and examined TOTAL FUMBLES in all games (as well as fumbles/game) but more importantly, TOTAL OFFENSIVE PLAYS RUN. Thus, we can to determine average PLAYS per FUMBLE, a much more valuable statistic. The results are displayed in the chart below. Keep in mind, this is for all games since 2010, regardless of indoors, outdoors, weather, site, etc. EVERYTHING.
Good news! The author tells us that everything is included now! Because, of course, everything was not included in the first statistic given in this analysis, making it more or less useless.
At this point, Sharp presents a figure with a pair of y-axes and some funky symbols. It's usually quite a bad idea to have differing y-axes on the same graph, but the author does so anyway.
You don't need to see the chart to guess what conclusion you're meant to draw from here, but let's take a look anyway:
One can CLEARLY SEE the Patriots, visually, are off the chart. There is no other team even close to being near to their rate of 187 offensive plays (passes+rushes+sacks) per fumble. The league average is 105 plays/fumble. Most teams are within 21 plays of that number.
The Patriots are indeed nearly off the chart, but that is partially because the author uses the smallest y-axis possible to demonstrate the largest effect that he could. It's generally preferred to use a y-axis that begins at 0, as any other scale is misleading and, in all likelihood, sensationalistic. (There are a few exceptions to this, but rarely so straightforward as this.)
To put it another way, imagine four men standing side-by-side, and three of them range from 6-foot-1 to 6-foot-4; the fourth is 6-foot-6. The tallest man is tall no matter how you frame the men, but if you turn all four into lines on a chart, and start the chart at the shortest man's eyebrows, it's going to paint a certain image of the actual difference in heights.
I spoke with a data scientist who I know from work on the NFLproject.com website, and sent him the data.
As a reader, you should know that you are in trouble if you see something like this.
The author describes himself at the bottom of the page as an industry pioneer at the forefront of incorporating advanced analytics and metrics. So why would an "industry pioneer" need to send something like this to a data scientist?
He [the data scientist] said:
Based on the assumption that fumbles per play follow a normal distribution, you'd expect to see, according to random fluctuation, the results that the Patriots have gotten over this period, once in 16,233.77 instances".
First off, thank goodness we are going to 2 decimal places for accuracy. Was 1 in 16233 not enough for readers to understand? But that's not our main issue with this statement.
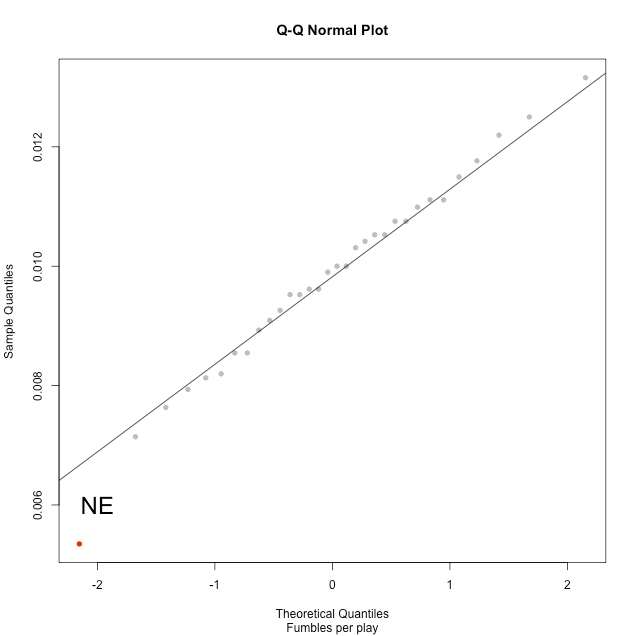
Per the "data scientist," let's assume that fumbles per play follows a normal distribution. This, in fact, does seem like a reasonable assumption based on the following Q-Q plot (the points should all fall near the line if the data is normal).
Given that the normality assumption is valid, we can calculate the Z-score for fumbles per play for the Patriots. To do this, we take the Patriots fumbles per play (0.00535) and subtract the mean of fumbles per play for each team (0.00983) and divide by the standard deviation of fumbles per play for each team (0.00165). This yields a Z-score of -2.71. Still assuming a normal distribution, a team would only be better than this (i.e. have a lower Z-score) about 0.336% of the time, or 1 in 297. That's pretty rare, but nowhere near 1 in 16233.77. So where did that 16000-ish number come from?
It's arrived at by using plays per fumble, rather than fumbles per play. If you use plays per fumble and calculate the same Z-score for the Patriots you get 3.84. We can then calculate that a team will do better than this (i.e. have a higher Z-score; higher is better for plays per fumble) about 1 in 16256. So we're guessing this is where that number comes from.
The problem is that this calculation also relies on the assumption of normality, which holds for fumbles per play, but NOT for plays per fumble (see the Q-Q plot)!
The "data scientist" and the author validly assumed that fumbles per play followed a normal and then went ahead and calculated the Z-score based on plays per fumble, a variable that is strongly skewed to the right. Formally, X being normal does not imply that 1/X is also normal.
If this is how that happened, it would be a sloppy misstatement of statistics stemming from an arbitrary preference in diction. Either that, or the author just went for the most improbable result that he could find.
Which in layman's terms means that this result only being a coincidence, is like winning a raffle where you have a 0.0000616 probability to win. Which in other words, it's very unlikely that it's a coincidence.
Good clarification for all the laymen out there. Laymen love probabilities like 0.0000616. Much clearer than that "1 in 16233.77."
I actually went back and researched 5 year periods for the entire NFL over the last 25 years. The Patriots ratio of 187 plays to 1 fumble is the BEST of ANY team in the NFL for ANY 5 year span of time over the last 25 years. Not was it just the best, it wasn't close:
1. 2010-2014 Patriots: 187 plays/fumble
2. 2009-2013 Patriots: 156 plays/fumble
3. 2006-2010 Colts: 156 plays/fumble
Here, the author curiously ranks the Patriots #2 and the Colts #3, despite the fact that the teams appear to have the same number of plays per fumble (156).
4. 2005-2009 Colts: 153 plays/fumble
5. 2007-2011 Patriots: 149 plays/fumble
6. 2008-2012 Patriots: 148 plays/fumble
7. 2010-2014 Texans: 140 plays/fumble
8. 2004-2008 Colts: 139 plays/fumble
9. 2006-2010 Jets: 135 plays/fumble
10. 1999-2003 Chiefs: 134 plays/fumble
At this point, an intelligent reader should pick up on one issue with the author's metric. The team sharing the 'suspiciously high plays-per-fumble rate' mantle with the Patriots is none other than the Peyton Manning quarterbacked Indianapolis Colts.
Why does this matter?
Because, Manning and Brady are generally among the quickest in football at getting rid of the ball when dropping back to throw. In fact, according to Pro Football Focus (PFF), Manning led the league in time-to-throw in 2014, at a lightning-quick 2.24 seconds. Brady finished 3rd in 2014, and also ranked 3rd, 1st, and 4th between 2011 and 2013 (PFF stats only go as far back as 2011). Even better, Brady also posted the league's lowest sack-per-dropback rate in 2014.
It's not a great strategy to penalize Brady and the Patriots for a lack of fumbles when there was a lower chance of fumbling to begin with, based on the team's play-calling and personnel that yield quick throws and incompletions, as well as fewer sacks.
So what's a better metric?
Well, one idea would be to compare running backs on fumbles per rush, or receivers on fumbles per reception. To look at quarterbacks is a much more difficult task, given the different speeds at which they get rid of the ball and how often they take sacks, but you might look at something like fumbles per sack or fumbles per QB hit. But the point remains: when quarterbacks throw quickly and avoid sacks, it's seemingly much less likely for the play to end in a fumble. More on this later.
Ironically, as my study yesterday showed, the Patriots performance in wet weather home games mysteriously turned ridiculous starting in 2007. In 2006, they went 0-2. From 2007 onward, they went 14-1.
But the Patriots have been really good between 2007-2014 whether or not it's raining. They were also good at home (57-7), in their division (36-10), in their conference (75-21), and out of their conference (25-7). Also, is the author really using a sample size of two before 2006 in his argument?
Let's get nerdy again. From 2007-2014 the Patriots were 100-28 in the regular season for a winning percentage of 78.1%. If you randomly choose any set of 15 of those 128 games, that set of games will be 14-1 or 15-0 a little more than 11% of the time. In other words, that's not statistically significantly different than their overall winning percentage. In other words also, this argument is garbage.
To further illustrate how these numbers are astonishing, the below graphics lay out clearly how far off the Patriots are from the rest of the league. Its evident to the eye how far removed they are from the norm. Whether we look at a histogram laying it out, where the Patriots and their 187 plays/fumble is far from the "bell shaped curve":
Actually, if you look at fumbles per play it is bell shaped. There is no denying that the Patriots had a good year in terms of not fumbling the ball, but it's not a once-in-the-heat-life-of-the-universe occurrence. Maybe more like once-in-ten-years, assuming that this metric is the correct one to use.
..or the same chart as above, this time displaying color bands as we move away from the 105 plays/fumble average. You can see the darker red band contains all teams but the bottom 3 and the top 3, and that the bottom 3 are very close to the darker red band. Meanwhile, the Patriots are really in a league of their own:
[Here, the author simply re-pastes a graph he'd used a few lines earlier, this time with one bar colored red to represent the Patriots. It's not overly useful.]
Could the Patriots be so good that they just defy the numbers? As my friend theorized: Perhaps they've invented a revolutionary in-house way to protect the ball, or perhaps they've intentionally stocked their skill positions with players who don't have a propensity to fumble. Or perhaps still, they call plays which intentionally result in a lower percentage of fumbles. Or maybe its just that they play with deflated footballs on offense. It could be any combination of the above.
Could it be that the Patriots have one of the best quarterbacks of all time? Or perhaps it's because they have the best coaches of all time? Or perhaps it's because Gisele taught Tom Brady and his receivers how to fake hanging onto the ball using secret supermodel makeup tips—she and Brady started dating in 2007, after all. Or perhaps it's Robert Kraft's blue shirt/white collar combo. It could be any combination of the above, this line of inquisition would argue.
If we're really worried about quarterbacks playing the balls the way they like, why aren't we talking about Aaron Rodgers, who led the league with the fewest interceptions and has admitted that he likes his ball over-inflated?
But regardless of what, specifically, is causing these numbers, the fact remains: this is an extremely abnormal occurrence and is NOT simply random fluctuation.
And back to the caps. And the fact remains, it's difficult to learn anything from this analysis.
There are a few other problems with the SharpFootball investigation that we didn't even bring up—issues of multiple testing and the post-hoc fallacy, for example—but we figured it was more important to provide a different look at New England's fumble rates than to continue rambling about best practices.
We'd also encourage interested readers to check out Brian Burke's post at Advanced Football Analytics for a more reasoned take on fumble rates. However, Burke likewise restricts his analysis to "fumbles per play," which we believe is a bit broad, because all offensive plays are not created equal.
Going back to 2007, we isolated the running back rushing attempts and wide receiver receptions made by each team, using easily downloadable data from NFL.com. There is a downside to this, however, as we do not get to look at quarterback-specific fumble rates. But including quarterbacks requires worrying about the pressure each one faced and the time each one had to release the ball, which can vary by team and offensive system; quarterback hits and sacks, likewise, are harder to fit into a single silo than rushes or receptions. It would also give the appearance of fewer fumbles per play among teams with a higher percentage of plays involving quick throws, incompletions, and interceptions. These are the types of plays where fumbles are less likely to occur, so the result is an inflation of the denominator in fumbles per play.
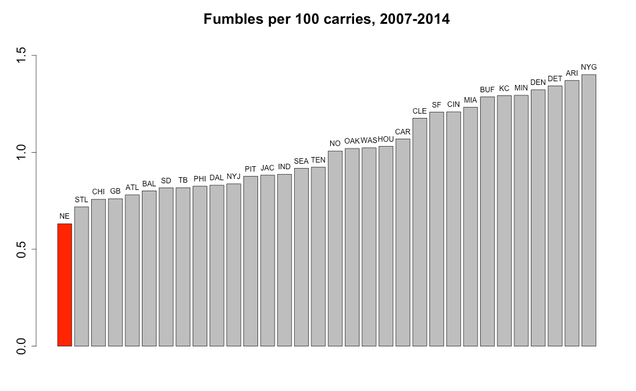
There's less variability to worry about with running backs and wide receivers, however. Here's a plot of the fumbles per 100 rushes, using running backs and fullbacks only.
New England running backs have the fewest fumbles per 100 rushes (about 0.6) of any NFL team going back to 2007, but the difference between New England and the rest of the league isn't as extreme as previous authors suggested—its about 1.5 to 2 fumbles per season. And this puts a point on the whole indictment of these posts: There are some broad and relatively minor observations to be made, if you're conspiratorially-minded enough to make the effort, they just don't have the statistical muscle that you'd expect given how widely they've traveled.
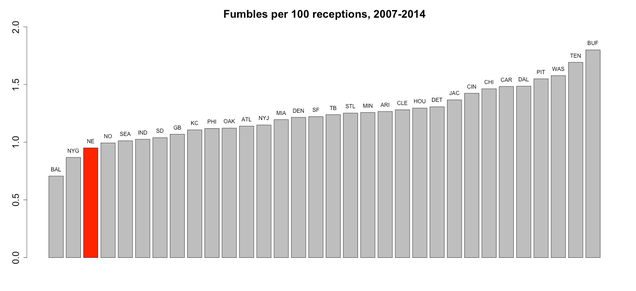
Here's a similar metric, using fumbles per 100 receptions. Only fumbles after receptions are shown here, meaning that special teams fumbles and muffed punts are not included, and the study group includes wide receivers, tight ends, and running backs.
New England finished with the third-lowest fumble rate on receptions, looking at all regular season plays between 2007 and 2014. Interestingly enough, the Ravens, who have been cited as one of the possible whistle blowers for Ballghazi, post the lowest per-reception fumble rate.
Given the number of teams in the league, it is not far-fetched to see one with fumble rates this low. Neither of these results appear all that extreme or insane, and, most certainly, they are not "extremely abnormal."
Additional analysis could also average over the per-game differences in fumble rates, which would help to further isolate the conditions on each game day, and would help mitigate the effects of each game's conditions and field surface. From our graphs, however, it doesn't seem all that obvious that teams with indoor stadiums fumble less often, which is a point that both Burke and SharpFootball tried to make. Detroit, for example, boasts the second-highest RB fumble rate using our metric, despite playing home games indoors.
If better context for quarterback possessions and fumbles were made available, a comparison of the fumble rates of QBs would be warranted as well.
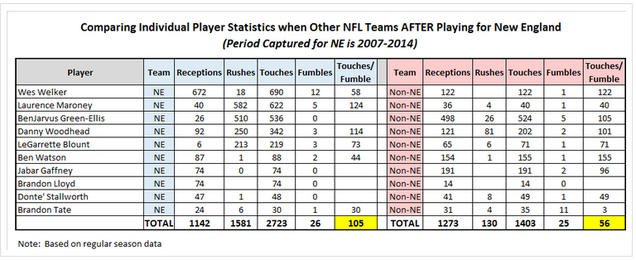
As a final postscript, we'll touch briefly on the third post in the series (here). It has its share of issues, like using an aggregated two-sample comparison despite having paired data, and the continued use of the skewed plays per fumble data, but our favorite part of the new post is that the author posts his individual player data, which demonstrates that not only is he using inappropriate methods, but he is also using the wrong data.
Can you tell what's wrong the data in this table?
Look in the bottom row. Brandon Tate is listed as having 11 fumbles in 35 touches during his time playing for "Non NE". That's absurd. How is that possible? Is Tate a fumbling machine?
Of course not.
According to NFL.com, all 11 of Tate's fumbles during his four years with the Bengals came on kick or punt returns, and because special teams fumbles use different balls, there is no reason for them to be included in this analysis. In other words, not only was the author using inappropriate methods in all three of his posts, but there is a reason to believe he also wasn't using the correct data, either.
While the best part of statistics is analyzing the data, what can make the subject so challenging is the breadth of work that is required in addition to the analysis phase. Tasks like cleaning your data, checking for its accuracy, and examining the validity of your assumptions, however, aren't just recommendations—they're requirements. And without considering these subtle but important steps in any investigation, its easy for any of us to drop the ball.
Gregory J. Matthews is an assistant professor of statistics at Loyola University Chicago. He completed his Ph. D. at the University of Connecticut in 2011. Matthews is a co-author of openWAR and actively blogs at statsinthewild.com. You can follow him on Twitter @statsinthewild.
Michael Lopez (@statsbylopez) is an assistant professor of statistics at Skidmore College.
 News
News  Market Data
  Discover