With our market timing model remaining in “buy” mode, our current focus primarily remains on leading individual stocks.
Tesla ($TSLA), for example, is now showing an unrealized gain of 68% since our December 31 buy entry in The Wagner Daily newsletter. SolarCity ($SCTY) is similarly up 56% since our December 19 buy entry.
However, despite strength in leadership stocks, we have also been noticing a stealth sector rotation of institutional funds flowing into various commodity ETFs.
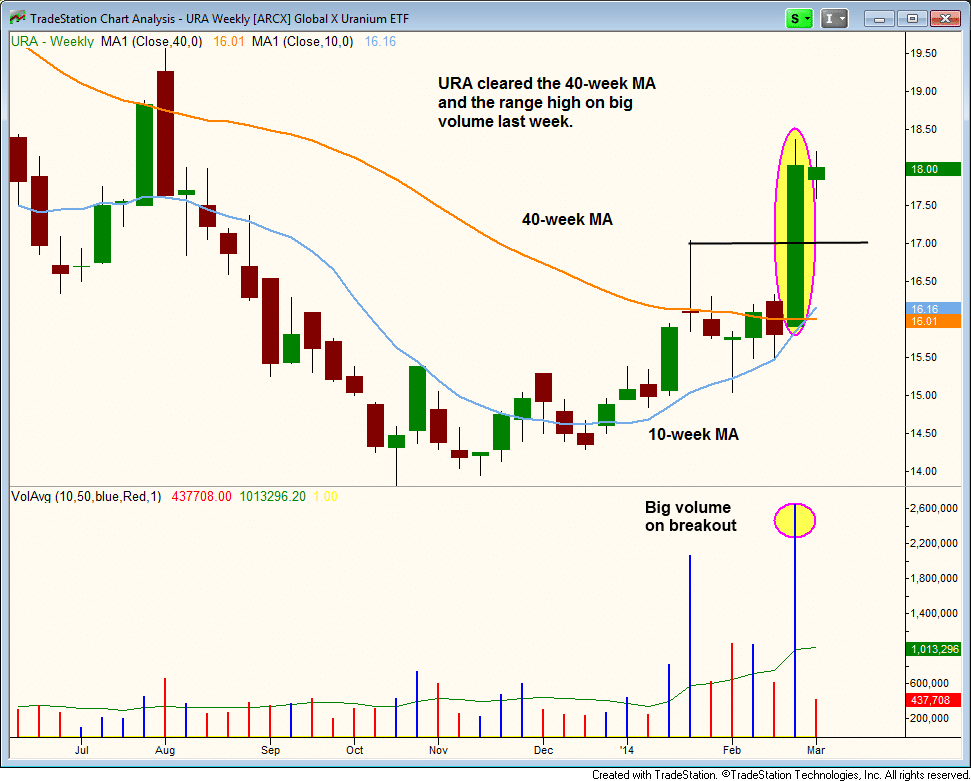
One such ETF we are stalking for potential buy entry in the coming days is Global X Uranium ETF ($URA), which is shown on the weekly chart below:
$URA blasted through the high of its prior trading range and 40-week moving average, on volume that was about 400% greater than average. High volume on a breakout is important because it confirms the presence of institutional accumulation.
Additionally, $URA closed near its high of the most recent week. The 10-week moving average crossed above the 40-week moving average as well, which signals a bullish reversal of trend is under way.
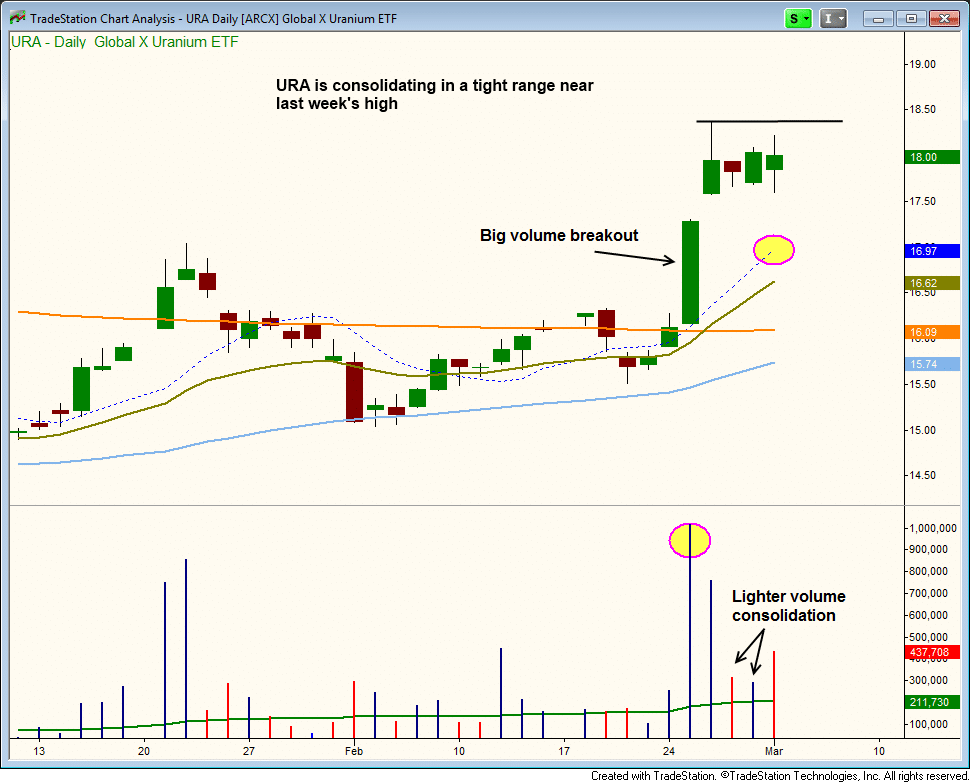
Since breaking out above its recent highs on heavy volume last week, the price has been consolidating for a few days on declining volume. Lighter volume during bullish consolidations is positive because it indicates the sellers are not stepping in while the bulls take a rest. This can be seen on the daily chart pattern:
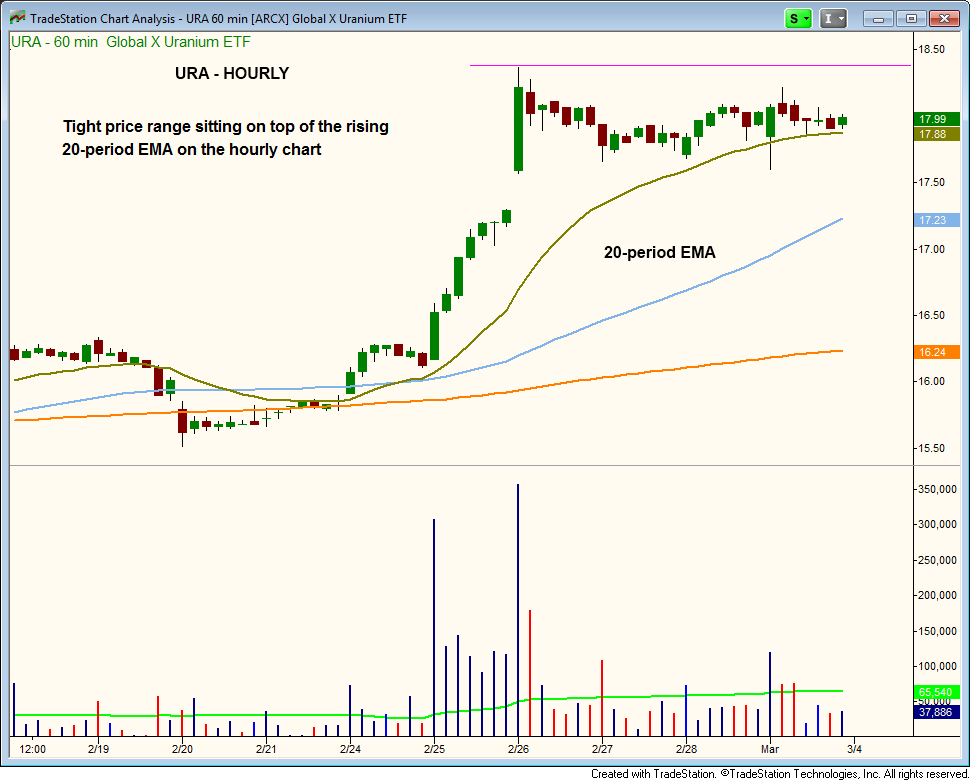
From here, we now expect about five to ten days of sideways action before $URA resumes its uptrend. Zooming into the shorter-term hourly chart interval, we see the price action is holding above the 20-period exponential moving average:
As detailed in my book, Trading ETFs: Gaining An Edge With Technical Analysis, the 20-period exponential moving average on the hourly chart is usually the first legitimate support level on a pullback after a strong breakout.
The strongest breakouts will hold support at the 20-period exponential moving average and then push higher. But if that moving average fails to hold as support, then a touch of the 10-day moving average is the next logical support level.
Because of the confirmation through multiple timeframe analysis, we are now stalking $URA for potential swing trade buy entry.
Regular subscribers of our swing trading newsletter should note our exact entry, stop, and target prices in the “Watchlist” section of today’s report.
Register for free to join our community of investors and share your ideas. You will also get access to streaming quotes, interactive charts, trades, portfolio, live options flow and more tools.


 News
News  Market Data
  Discover