


| Followers | 2 |
| Posts | 113 |
| Boards Moderated | 0 |
| Alias Born | 09/26/2012 |
Tuesday, January 14, 2014 10:30:13 AM
Why You Shouldn't Worry About A Market Pullback
Stocks fell hard yesterday (January 13), igniting the usual fears that it’s time to sprint for the exit doors and sell all your stocks.
But just wait! Grab a seat, close your eyes, take a deep breath, and let’s objectively assess the situation on a technical level.
Although the NASDAQ and S&P 500 tumbled 1.5% and 1.3% respectively, you must ignore fear-mongering of the financial media and keep the January 13 sell-off in perspective.
If you are new to stock trading, you must know that bull markets do not trend in a straight line (the same is true of bear markets).
Rather, even the strongest uptrending market undergoes the occasional pullback along the way. Then, after catching its breath for a month or two, buyers return to the scene and once again drive stocks to new highs.
This cycle of a rally, pullback (or consolidation), then rally again is what forms the “higher highs” and “higher lows” of any healthy market uptrend.
Furthermore, the longer a market rallies without a pullback, the more severe the eventual correction off the highs will be. As such, it’s better to have a correction now, rather than after stocks have entered into a parabolic moonshot.
I personally welcomed yesterday’s pullback because it is likely the start of a healthy, short-term correction that is necessary in order for stocks to take a break before eventually marching higher again. But in the meantime, you may be wondering…
Where will the main stock market indexes find support?
Because of the intensity of the January 13 sell-off, it is unlikely that stocks will immediately snap back. Rather, short-term bearish momentum is likely to keep the bulls in check for at least the next several weeks (one to two months more likely).
To help give you an idea of where the S&P 500, NASDAQ, and other indexes may find their next levels of price support, I have annotated the daily charts of several popular, broad-based ETFs. While looking at the charts below, keep in mind:
1.) During stock market corrections, key technical support levels generally get “undercut” (quickly probe below the obvious support level, then rebound just a few days later).
2.) It is better to think of support as an area or zone, rather than just a precise “line in the sand.”
3.) We love to see bullish reversal candlesticks (such as “hammers” or “engulfing” patterns) that substantially undercut key support levels.
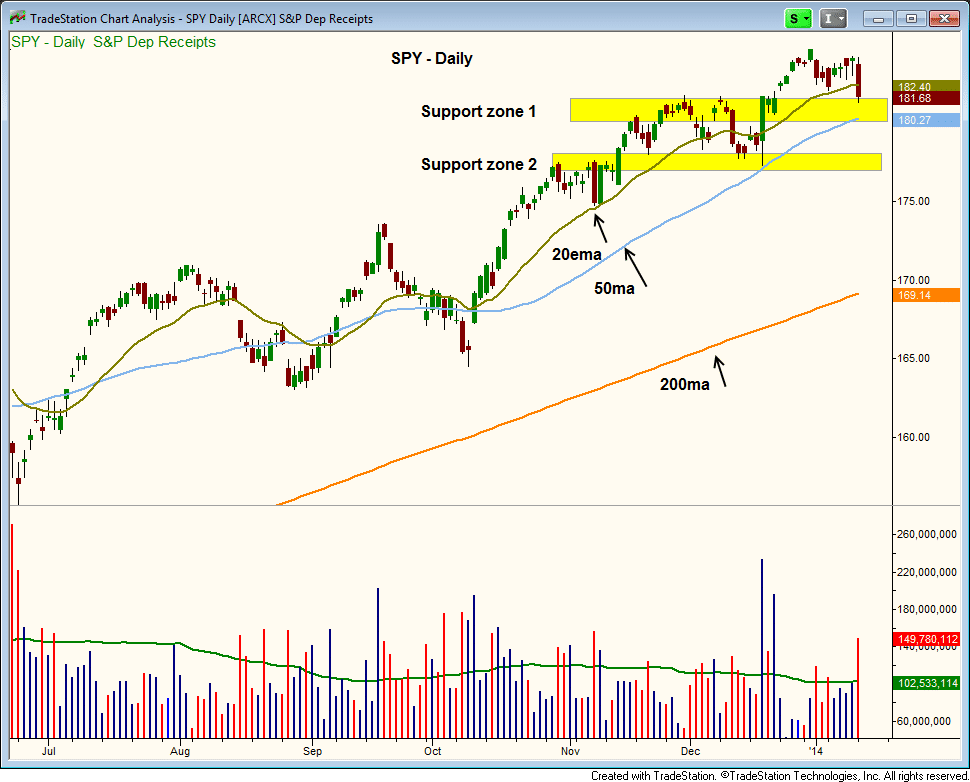
S&P 500 ETF ($SPY)
Let’s begin with the S&P 500 SPDR ($SPY), an ETF proxy for the benchmark S&P 500 Index.
The first zone of support for $SPY is convergence of its prior highs from November/December and 50-day moving average (around $180-$181). If that band of support (not much below the current price) is breached, expect $SPY to find support near the prior “swing low” from December (labeled as “Support zone 2?):
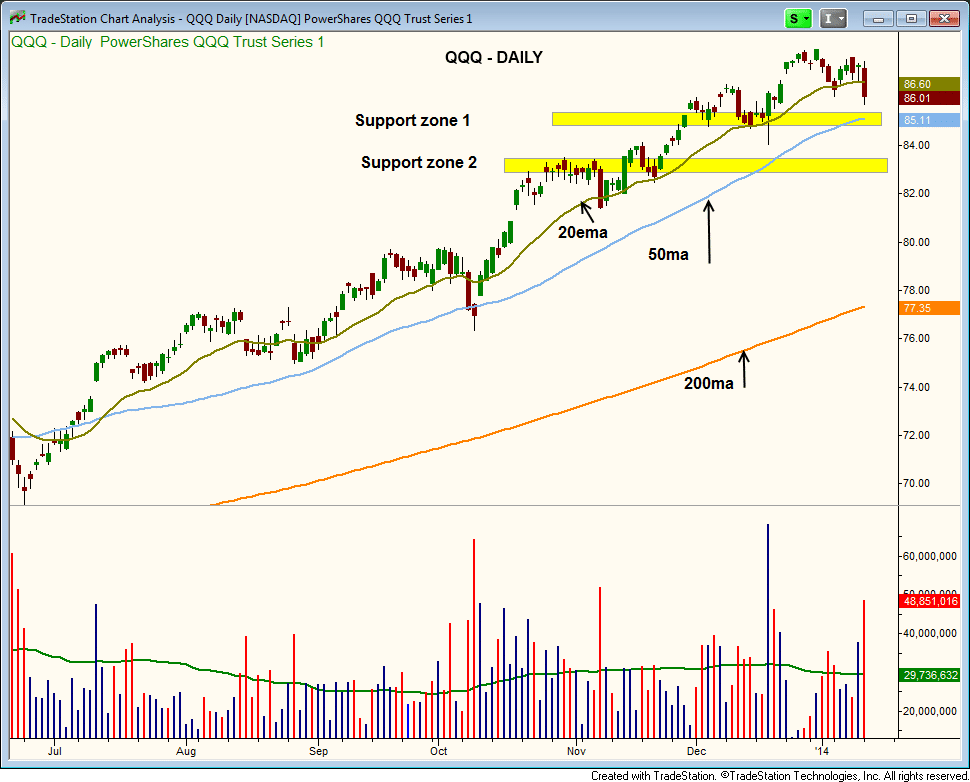
NASDAQ 100 ETF ($QQQ)
PowerShares QQQ Trust ($QQQ), a very popular ETF that tracks the tech-heavy NASDAQ 100 Index, is nearing support of its 50-day MA, which converges with its prior swing lows (around $85). The second zone of support is formed from the basing action in October and November (around $83):
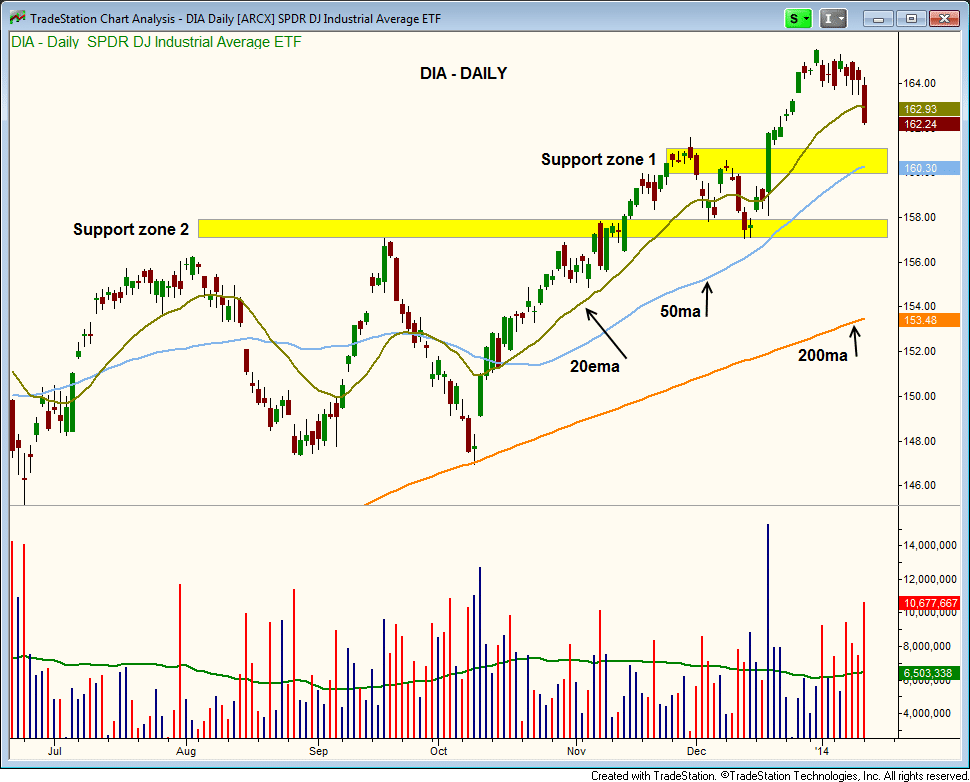
Dow Jones Industrials ETF ($DIA)
The Dow Jones Industrial Average SPDR ($DIA) has support from a prior swing high and 50-day moving average, which are converging around the $160 area.
The second level of support is from the highs of September and October 2o13, along with a prior swing low in December (around $157):
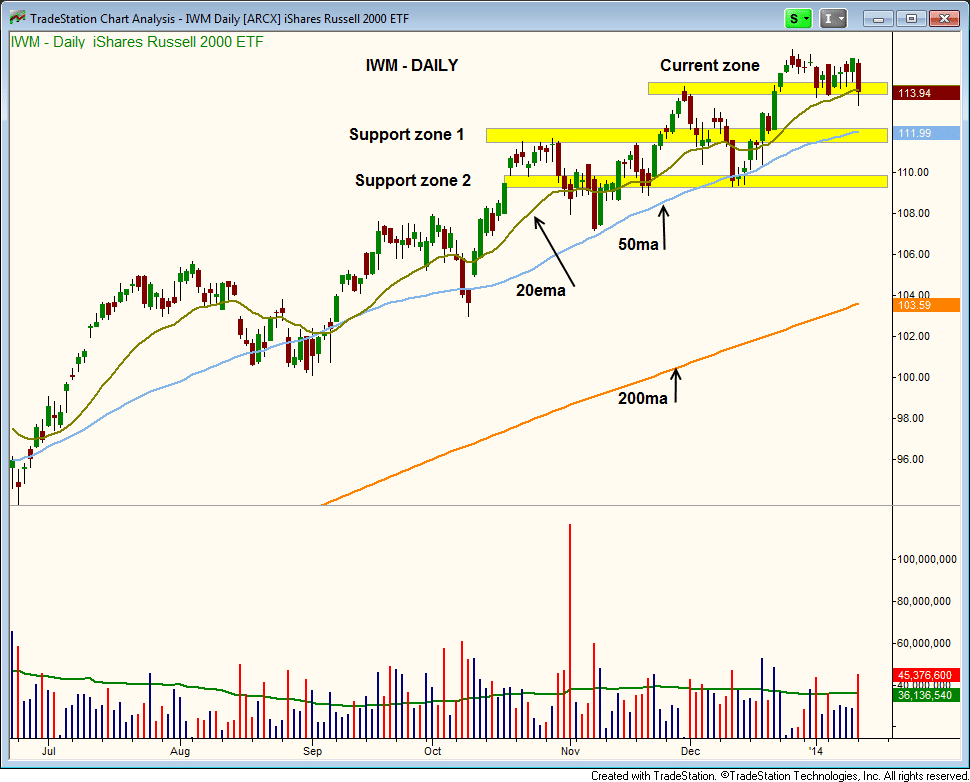
Small-cap Russell 2000 ETF ($IWM)
The iShares Russell 2000 ETF ($IWM) is currently sitting at support from its November 2013 high, as well as its rising 20-day exponential moving average.
The next major support level is the 50-day moving average ($112 area), while the second zone of support is the prior swing lows (just below $110):
As you can see, there is a plethora of technical support below the current prices of the main stock market indexes.
As long as the major averages remain above their 50-day moving averages, and leadership stocks continue holding above pivotal support levels, our stock market timing model will remain in “buy” mode.
If you missed the most recent leg of the rally and have been waiting for a substantial pullback to start buying stocks, consider waiting for a bullish reversal pattern to form as the major indices test support.
Patience Pays Off Again
Over the past few days, we at Morpheus have been doing a bit of housekeeping in the portfolio of our swing trade newsletter by taking profits on winning swing trades, while bailing out of a few dogs.
On the January 13 open, we sold Tekmira Pharmaceutical Corp. ($TKMR) for a share price gain of +56.1% since our November 29 buy entry.
That same day, we unloaded HomeAway ($AWAY) for a 10% gain, and also locked in a gain of +15.3% in Direxion Financial Bull 3x ($FAS), a leveraged financial ETF, when it hit our tight trailing stop.
On the downside, disappointing price action in US Silica ($SLCA) caused us to stop out with a 15.3% loss the same day (basically a wash with the 15.3% gain in $FAS).
On January 10, we sold Montage Technology ($MONT) for +21.2% gain and partial shares of Shutterstock ($SSTK) for +18.5%.
Finally, we are selling Montage Technology Group ($MONT) on today’s open, in order to lock in the better part of our 27.4% unrealized gain. Although this trade is up nearly 30% since our entry just one week ago, we are making a judgment call to take the quick profit and run because $MONT is not an “A-rated” setup.
In this blog, we like to remind you that lots of patience is necessary when holding on to winners, and several of the intermediate-term swing trades we’ve recently closed are a good example of this.
On the other hand, never forget that it’s equally important to get the hell out of Dodge when stocks go the wrong way and hit your stops.
Don’t Make Like Nostradamus
How deep will the developing correction take stocks, and how long will stocks remain in pullback mode? We don’t have a clue!
More importantly, we don’t even care because we will simply follow our rule-based trading plan, rather than becoming a hostage to emotions.
In the near-term, our simple, objective plan is to take profits on non-core positions (momentum swing trades) when we can, while holding on to core positions (A-rated stocks) as long as the market timing model remains in “buy” mode.
As always, the key to our trading system is not to predict what is going to happen, but to simply react to what is actually happening. Remember our mantra is to trade what you see, NOT what you think!
Stocks fell hard yesterday (January 13), igniting the usual fears that it’s time to sprint for the exit doors and sell all your stocks.
But just wait! Grab a seat, close your eyes, take a deep breath, and let’s objectively assess the situation on a technical level.
Although the NASDAQ and S&P 500 tumbled 1.5% and 1.3% respectively, you must ignore fear-mongering of the financial media and keep the January 13 sell-off in perspective.
If you are new to stock trading, you must know that bull markets do not trend in a straight line (the same is true of bear markets).
Rather, even the strongest uptrending market undergoes the occasional pullback along the way. Then, after catching its breath for a month or two, buyers return to the scene and once again drive stocks to new highs.
This cycle of a rally, pullback (or consolidation), then rally again is what forms the “higher highs” and “higher lows” of any healthy market uptrend.
Furthermore, the longer a market rallies without a pullback, the more severe the eventual correction off the highs will be. As such, it’s better to have a correction now, rather than after stocks have entered into a parabolic moonshot.
I personally welcomed yesterday’s pullback because it is likely the start of a healthy, short-term correction that is necessary in order for stocks to take a break before eventually marching higher again. But in the meantime, you may be wondering…
Where will the main stock market indexes find support?
Because of the intensity of the January 13 sell-off, it is unlikely that stocks will immediately snap back. Rather, short-term bearish momentum is likely to keep the bulls in check for at least the next several weeks (one to two months more likely).
To help give you an idea of where the S&P 500, NASDAQ, and other indexes may find their next levels of price support, I have annotated the daily charts of several popular, broad-based ETFs. While looking at the charts below, keep in mind:
1.) During stock market corrections, key technical support levels generally get “undercut” (quickly probe below the obvious support level, then rebound just a few days later).
2.) It is better to think of support as an area or zone, rather than just a precise “line in the sand.”
3.) We love to see bullish reversal candlesticks (such as “hammers” or “engulfing” patterns) that substantially undercut key support levels.
S&P 500 ETF ($SPY)
Let’s begin with the S&P 500 SPDR ($SPY), an ETF proxy for the benchmark S&P 500 Index.
The first zone of support for $SPY is convergence of its prior highs from November/December and 50-day moving average (around $180-$181). If that band of support (not much below the current price) is breached, expect $SPY to find support near the prior “swing low” from December (labeled as “Support zone 2?):

NASDAQ 100 ETF ($QQQ)
PowerShares QQQ Trust ($QQQ), a very popular ETF that tracks the tech-heavy NASDAQ 100 Index, is nearing support of its 50-day MA, which converges with its prior swing lows (around $85). The second zone of support is formed from the basing action in October and November (around $83):

Dow Jones Industrials ETF ($DIA)
The Dow Jones Industrial Average SPDR ($DIA) has support from a prior swing high and 50-day moving average, which are converging around the $160 area.
The second level of support is from the highs of September and October 2o13, along with a prior swing low in December (around $157):

Small-cap Russell 2000 ETF ($IWM)
The iShares Russell 2000 ETF ($IWM) is currently sitting at support from its November 2013 high, as well as its rising 20-day exponential moving average.
The next major support level is the 50-day moving average ($112 area), while the second zone of support is the prior swing lows (just below $110):

As you can see, there is a plethora of technical support below the current prices of the main stock market indexes.
As long as the major averages remain above their 50-day moving averages, and leadership stocks continue holding above pivotal support levels, our stock market timing model will remain in “buy” mode.
If you missed the most recent leg of the rally and have been waiting for a substantial pullback to start buying stocks, consider waiting for a bullish reversal pattern to form as the major indices test support.
Patience Pays Off Again
Over the past few days, we at Morpheus have been doing a bit of housekeeping in the portfolio of our swing trade newsletter by taking profits on winning swing trades, while bailing out of a few dogs.
On the January 13 open, we sold Tekmira Pharmaceutical Corp. ($TKMR) for a share price gain of +56.1% since our November 29 buy entry.
That same day, we unloaded HomeAway ($AWAY) for a 10% gain, and also locked in a gain of +15.3% in Direxion Financial Bull 3x ($FAS), a leveraged financial ETF, when it hit our tight trailing stop.
On the downside, disappointing price action in US Silica ($SLCA) caused us to stop out with a 15.3% loss the same day (basically a wash with the 15.3% gain in $FAS).
On January 10, we sold Montage Technology ($MONT) for +21.2% gain and partial shares of Shutterstock ($SSTK) for +18.5%.
Finally, we are selling Montage Technology Group ($MONT) on today’s open, in order to lock in the better part of our 27.4% unrealized gain. Although this trade is up nearly 30% since our entry just one week ago, we are making a judgment call to take the quick profit and run because $MONT is not an “A-rated” setup.
In this blog, we like to remind you that lots of patience is necessary when holding on to winners, and several of the intermediate-term swing trades we’ve recently closed are a good example of this.
On the other hand, never forget that it’s equally important to get the hell out of Dodge when stocks go the wrong way and hit your stops.
Don’t Make Like Nostradamus
How deep will the developing correction take stocks, and how long will stocks remain in pullback mode? We don’t have a clue!
More importantly, we don’t even care because we will simply follow our rule-based trading plan, rather than becoming a hostage to emotions.
In the near-term, our simple, objective plan is to take profits on non-core positions (momentum swing trades) when we can, while holding on to core positions (A-rated stocks) as long as the market timing model remains in “buy” mode.
As always, the key to our trading system is not to predict what is going to happen, but to simply react to what is actually happening. Remember our mantra is to trade what you see, NOT what you think!
Join the InvestorsHub Community
Register for free to join our community of investors and share your ideas. You will also get access to streaming quotes, interactive charts, trades, portfolio, live options flow and more tools.

