Wednesday, October 09, 2013 4:18:08 PM
What you are showing in your chart is a triangle pattern...
http://stockcharts.com/school/doku.php?st=triangle&id=chart_school:chart_analysis:chart_patterns:symmetrical_triangle
Flags and pennants require evidence of a sharp advance or decline on heavy volumeThis move usually represents the first leg of a significant advance or decline and the flag/pennant is merely a pause.
2.Flagpole: The flagpole is the distance from the first resistance or support break to the high or low of the flag/pennant. The sharp advance (or decline) that forms the flagpole should break a trend line or resistance/support level. A line extending up from this break to the high of the flag/pennant forms the flagpole.
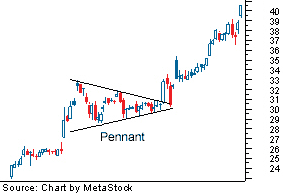
The flag and pennant patterns are two continuation patterns that closely resemble each other, differing only in their shape during the pattern's consolidation period. This is the reason the terms flag and pennant are often used interchangeably. A flag is a rectangular shape, while the pennant looks more like a triangle.
These two patterns are formed when there is a sharp price movement followed by generally sideways price movement, which is the flag or pennant. The pattern is complete when there is a price breakout in the same direction of the initial sharp price movement. The following move will see a similarly sharp move in the same direction as the prior sharp move. The complete move of the chart pattern - from the first sharp move to the last sharp move - is referred to as the flag pole.

http://www.investopedia.com/university/charts/charts6.asp
Flags and pennants can be categorized as continuation patterns. They usually represent only brief pauses in a dynamic market. They are typically seen right after a big, quick move. The market then usually takes off again in the same direction. Research has shown that these patterns are some of the most reliable continuation patterns.
Bullish flags are characterized by lower tops and lower bottoms, with the pattern slanting against the trend. But unlike wedges, their trendlines run parallel.
Bearish flags are comprised of higher tops and higher bottoms. "Bear" flags also have a tendency to slope against the trend. Their trendlines run parallel as well.
Pennants look very much like symmetrical triangles. But pennants are typically smaller in size (volatility) and duration.
(Volume generally contracts during the pause with an increase on the breakout.
http://www.chartpatterns.com/flagsandpennants.htm
Pennants are the workhorses of the day trader. They perform an invaluable service by marking the midway point in a move. However, if a pennant is not accompanied by a flagpole, then it's not a pennant. Also, performance depends on a strong price trend leading to the pennant.
North Bay Resources Announces Mt. Vernon Gold Mine Bulk Sample, Sierra County, California • NBRI • Sep 11, 2024 9:15 AM
One World Products Issues Shareholder Update Letter • OWPC • Sep 11, 2024 7:27 AM
Kona Gold Beverage Inc. Reports $1.225 Million in Revenue and $133,000 Net Profit for the Quarter • KGKG • Sep 10, 2024 1:30 PM
Element79 Gold Corp Announces 2024 Clover Work Plans & Nevada Portfolio Updates • ELMGF • Sep 10, 2024 11:00 AM
Nightfood Holdings Inc. Completes Major Step on Uplist Journey by Closing Strategic All-Stock Acquisition of CarryoutSupplies.com • NGTF • Sep 10, 2024 8:15 AM
Element79 Gold Corp. Announces Sale of 100% Interest in Elder Creek, North Mill Creek, and Elephant Projects to 1472886 B.C. Ltd. • ELEM • Sep 9, 2024 9:34 AM


