Our nightly stock screens have produced several high quality stock and ETF swing trade setups over the past several days. Within the realm of ETFs, a majority of the most bullish chart patterns are presently found in international ETFs. More specifically, ETFs of the Asian region are showing the most relative strength. In this article, we analyze the current chart patterns of two of them, both of which may be actionable within the next several days.
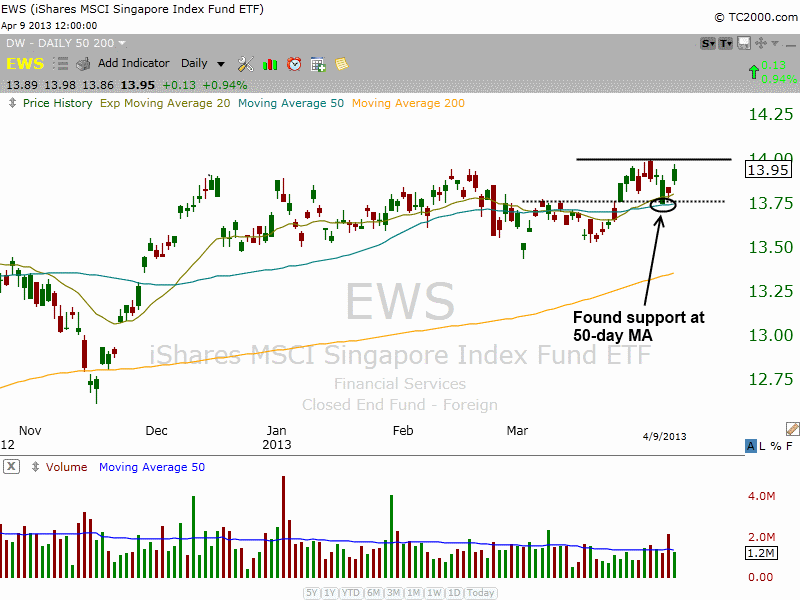
iShares MSCI Singapore Index Fund ($EWS) is back on our watchlist after a failed breakout attempt last February. Since then, the price action has undercut the 50-day moving average and popped back above it. After another false breakout attempt on April 3, $EWS found support from the rising 50-day MA and prior swing high (dotted black line), around $13.75. The daily chart of $EWS is shown below:
When possible, it is important to have multiple time frames confirming a potential trade (on recent IPOs we can’t). This means that we like to see something interesting happening on the weekly or monthly charts to support our analysis on the daily chart. That also goes for intraday charts, as the majority of our buy entries are placed above all major moving averages on the 5, 15, and 60-minute time frames.
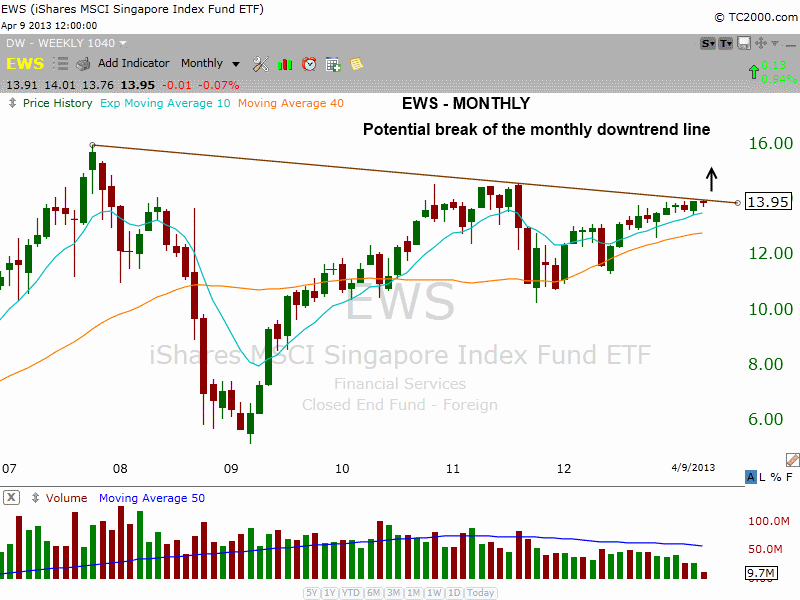
With $EWS, the monthly chart below shows a downtrend line in place with multiple touches of the anchor points. A breakout above the high of the current range should lead to a breakout above the monthly downtrend line:
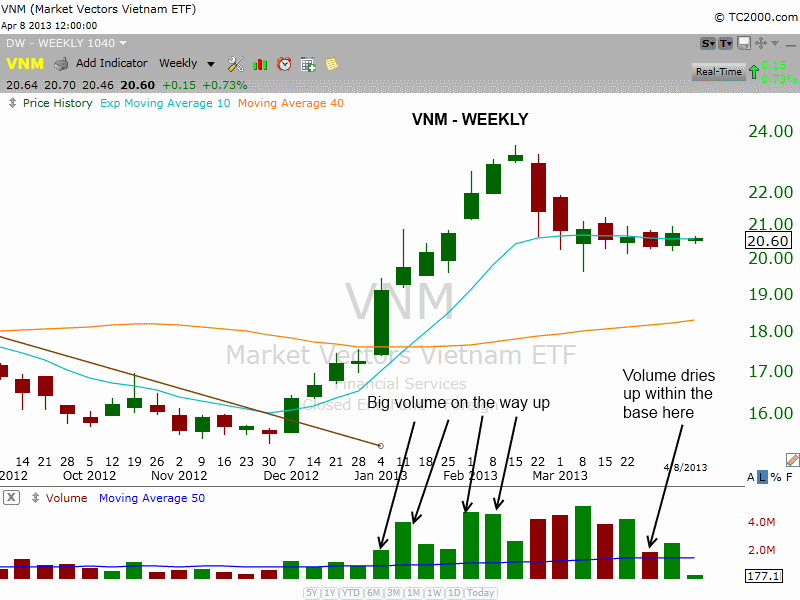
One of the best looking country ETF charts we found was the Market Vectors Vietnam ETF ($VNM).
The weekly chart is quite powerful, as it shows the huge pick up in volume during the rally as the price action cleared the 40-week MA (in orange). The price action is now consolidating in a tight range around 10-week MA (teal line). Also, note the dry up in volume two weeks ago, which indicates that investors have lost interest in trading $VNM as it continues to base out (this is bullish):
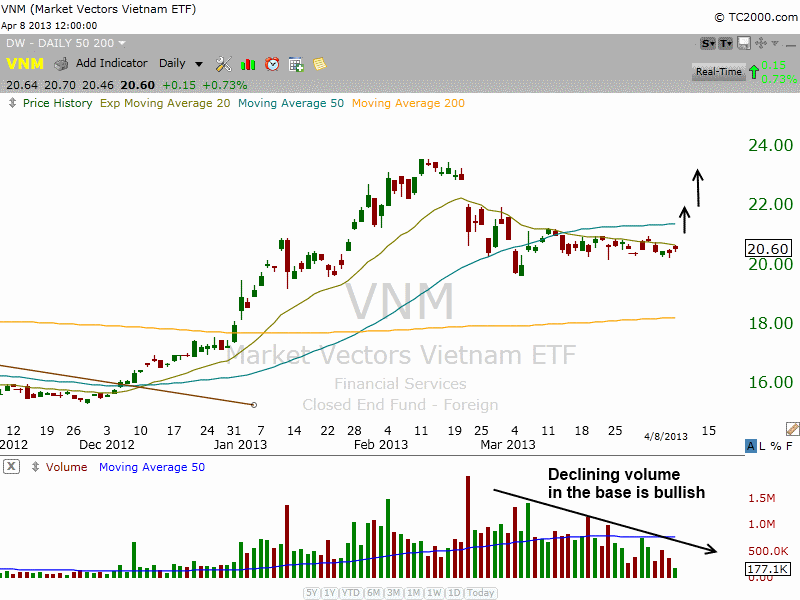
The daily chart in $VNM shows the tight price range just below the 20-day EMA. We can easily see the nice drop off in volume since March 27 as well.
A break above the three-day high is our buy entry, as this would put the price action above the 20-day EMA and the short-term downtrend line of the tight range. A break above $21 would also confirm that a higher swing low is in place on the daily chart:
In addition to $EWS and $VNM, iShares Indonesia Index ($EIDO), iShares Thailand Index ($THD), and iShares Philippines ($EPHE) are also on our internal watchlist. However, all three ETFs ideally need several more weeks of consolidation in order for their basing patterns to tighten up. Conversely, $EWS and $VNM have already formed potentially buyable patterns that could trigger in the next few days.
Whenever there are 5 or more “distribution days” (losses on higher volume) in a major index within a 3 to 4 week period, and leading stocks begin selling off on heavy volume, it is always a major concern. However, if the stock market is able to fight off the distribution AND quality bullish stock setups can still be found, then we must buy.
Sometimes it is easy to forget that we are swing trading individual stocks and ETFs, not the main stock market indexes. Above all, don’t forget our trading system is designed to react to price action, rather than attempting to predict it.
Register for free to join our community of investors and share your ideas. You will also get access to streaming quotes, interactive charts, trades, portfolio, live options flow and more tools.


 News
News  Market Data
  Discover