We spent several hours extensively scanning the markets over the weekend, and came to the conclusion that the current market environment is a choppy, sloppy mess. Although large-cap stocks continue to show relative strength, which enabled the Dow Jones Industrial Average to finish at a new 52-week high (on the weekly chart), the important Nasdaq Composite remains well below its prior highs from September of 2012.
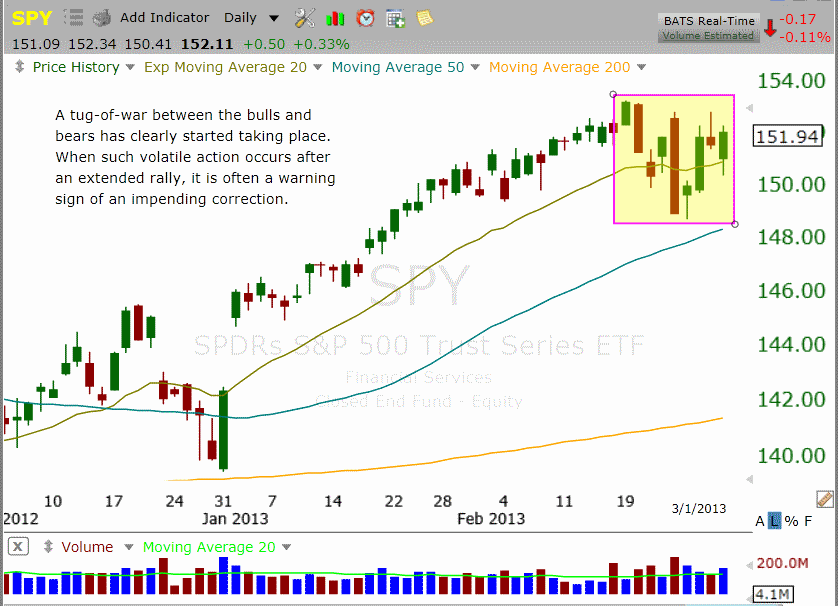
Clearly, the market has become fractured over the past two weeks. Like the Dow, the benchmark S&P 500 Index finished the week near its 52-week high. Nevertheless, it is becoming quite apparent that a tug of war between the bulls and bears are starting to take place. To illustrate that, just take a look at the following daily chart of the S&P 500 SPDR ($SPY), a popular ETF proxy for the S&P 500 Index:
When such major day-to-day volatility starts taking place after an extended rally, it is often a warning sign that a significant correction is about to take place. Furthermore, the Nasdaq remains in a rather precarious position, as the index has been struggling to hold on to key intermediate-term support of its 50-day moving average.
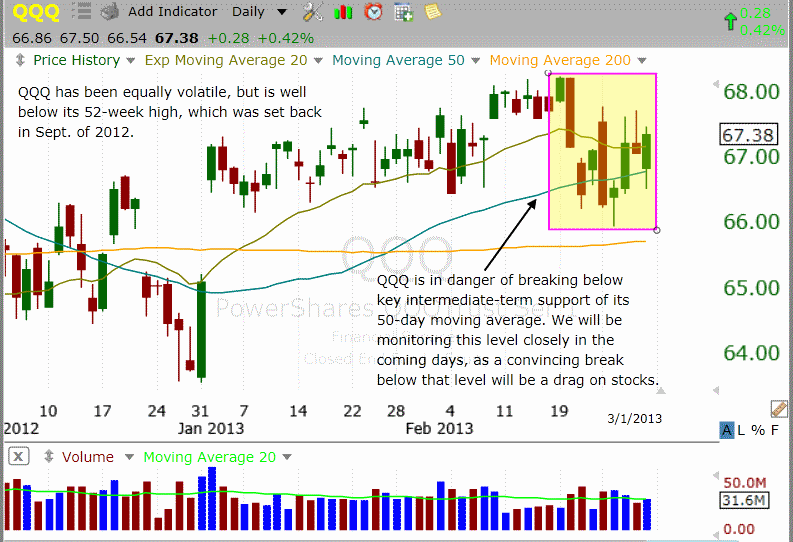
If the Nasdaq convincingly breaks down below its 50-day MA in the coming week (by closing below last week’s lows), it will certainly have a substantial drag on even the Dow and S&P 500. Below is the chart of the PowerShares QQQ Trust ($QQQ), an ETF which tracks the performance of the large Nasdaq 100 Index (the brother of the broader-based Nasdaq Composite):
Although the broad market has been “whiplash city” over the past week, it’s important to note the bearish volume patterns in the broad market continue to persist.
Since the February 19 peak, three of the four down days have been on higher volume (“distribution days”), while all four up days have been on lighter volume. While many technical indicators give false signals, volume is the one indicator that never lies because it is a clear footprint of institutional trading activity.
Since banks, mutual funds, hedge funds, pension funds, and other institutions control more than 50% of the market’s average daily volume, the direction of the stock market nearly always follows the institutional money flow. Right now, the volume patterns tell us that institutions remain in sell mode (so our market timing model is as well).
Although our timing model in sell mode, we continue to monitor leading stocks with the most relative strength. The top individual stock presently on our internal watchlist is LinkedIn Corp. ($LNKD), which we have already bought and sold twice for solid gains the past two months.
The first buy of $LNKD was in January, based on a “cup and handle” type chart pattern, which we sold into strength for an 11% gain ahead of earnings. The second buy was on a big gap up from its February 8 earnings report, which we also sold into strength for a nice profit. Check our blog (http://www.morpheustrading.com/blog) for an educational technical review of that second swing trade entry soon.
Not surprisingly, a majority of the ETFs in our weekend stock screening have similar chart patterns to the major indices, but we did spot one pocket of relative strength in the healthcare sector. iShares Biotech ($IBB), SPDR Health Care ETF ($XLV) and Vanguard Health Care ETF ($VHT) have either broken out to new 52-week highs or are poised to breakout within the next few days. However, given recent market conditions, a breakout in the current environment would have a higher than usual likelihood of failure. Conversely, low-risk short selling setups remain minimal as well.
Overall, we do not see any low-risk stock or ETF swing trade setups that are presently actionable. Therefore, the best plan of action is to sit on the sidelines primarily in cash until the market shows us the direction of its next move. Remember, we’re not in the business of predicting price action. Rather, we simply plan our trades according to the reaction the market is presenting us at any given time. It’s a much less stressful and more profitable way to run your trading operations over the long-term.
Register for free to join our community of investors and share your ideas. You will also get access to streaming quotes, interactive charts, trades, portfolio, live options flow and more tools.


 News
News  Market Data
  Discover