Monday, November 19, 2012 4:25:22 PM
http://www.investopedia.com/university/movingaverage/movingaverages4.asp#axzz2ChoynOBj
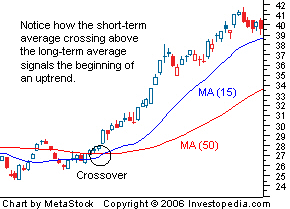
The second type of crossover occurs when a short-term average crosses through a long-term average. This signal is used by traders to identify that momentum is shifting in one direction and that a strong move is likely approaching. A buy signal is generated when the short-term average crosses above the long-term average, while a sell signal is triggered by a short-term average crossing below a long-term average. As you can see from the chart below, this signal is very objective, which is why it's so popular.

You can actually see in the daily chart that the last time this happened, we had our little run into the .002's, once there was a sell off, it went under and the price stayed under. Now we are about to cross back up and have good financials from the company. IMO
Price is now above the 10, 20 & 50 day.
Let's hope the trend continues here.
Recent BWMG News
- Form 10-Q - Quarterly report [Sections 13 or 15(d)] • Edgar (US Regulatory) • 08/30/2024 06:10:12 PM
- Form NT 10-Q - Notification of inability to timely file Form 10-Q or 10-QSB • Edgar (US Regulatory) • 08/14/2024 09:24:26 PM
- Form 10-Q - Quarterly report [Sections 13 or 15(d)] • Edgar (US Regulatory) • 07/17/2024 09:23:16 PM
- Form 8-K - Current report • Edgar (US Regulatory) • 05/29/2024 07:25:21 PM
- Form 10-K - Annual report [Section 13 and 15(d), not S-K Item 405] • Edgar (US Regulatory) • 05/09/2024 09:31:44 PM
- Form 8-K - Current report • Edgar (US Regulatory) • 02/13/2024 08:27:11 PM
- Form 10-Q - Quarterly report [Sections 13 or 15(d)] • Edgar (US Regulatory) • 11/20/2023 07:07:39 PM
- Form NT 10-Q - Notification of inability to timely file Form 10-Q or 10-QSB • Edgar (US Regulatory) • 11/14/2023 04:55:11 PM
North Bay Resources Announces Assays up to 5 oz/ton Gold, 1.5 oz/ton Platinum, 0.5 oz/ton Palladium, and 0.5 oz/ton Rhodium at Mt. Vernon Gold Mine, Sierra County, California • NBRI • Oct 4, 2024 9:15 AM
Basanite, Inc. Appoints Ali Manav as Interim Chief Executive Officer • BASA • Oct 3, 2024 9:15 AM
Integrated Ventures Announces Launch of MedWell Facilities, LLC and Lease Agreement with Giant Fitness Clubs • INTV • Oct 3, 2024 8:45 AM
Beyond the Horizon: Innovative Drug Combinations Offer New Hope for Alzheimer's and More • NVS • Oct 3, 2024 8:45 AM
SMX and FinGo Enter Into Collaboration Mandate to Develop a Joint 'Physical to Digital' Platform Service To Enhance Natural Rubber Industry's Ability to Report on Sustainable and Ethical Supply Chains • SMX • Oct 3, 2024 7:00 AM
Transforming Alzheimer's Treatment: Innovative Combinations to Boost Cognition • PFE • Oct 2, 2024 9:00 AM


