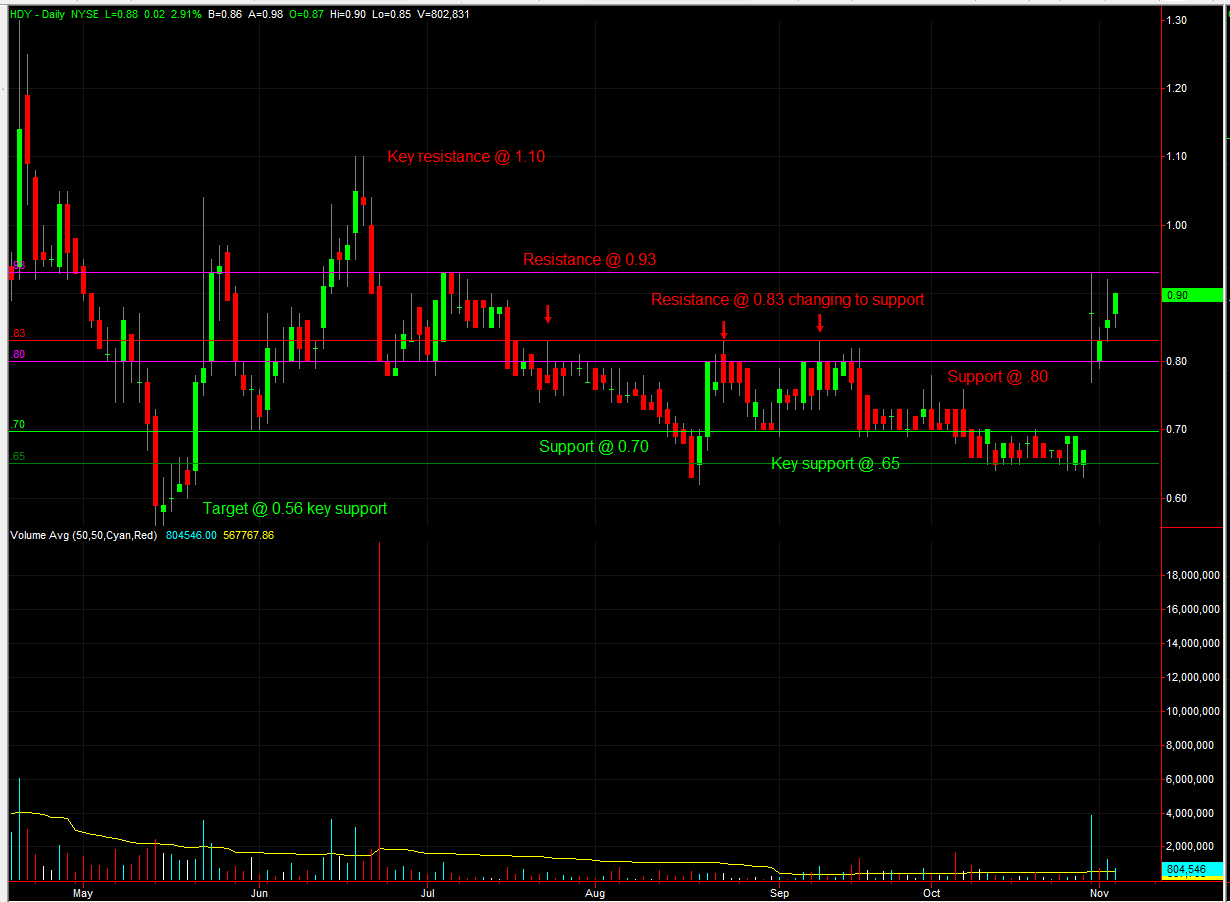
Day 4 of the rally and we see more advance, this time closing at the tip at 0.90.
Volume a bit lower than yesterday, but still above average.
.80 is now established as proximal support, with .83 a runner up.
It will be interesting to see what happens at resistance at .93 There should be plenty of profit sells and shorts waiting there to pounce, on the other hand, we see how the market likes round numbers such as .70, .80, .90, & $1.10 so perhaps we'll move right to test key resistance?
Those who bought at my first target of .70 can cash in 28% gain at .90, so it's no surprising we saw some selling. But the volume really kicked in at .85 cents, showing that the bulls are buying dips.
The HDY chart remains bullish, and only a sustained break below key support at .70 can change that.
It wasn’t the thinking that got me the BIG money, it was the sitting and waiting – Livermore
Register for free to join our community of investors and share your ideas. You will also get access to streaming quotes, interactive charts, trades, portfolio, live options flow and more tools.
 News
News  Market Data
  Discover