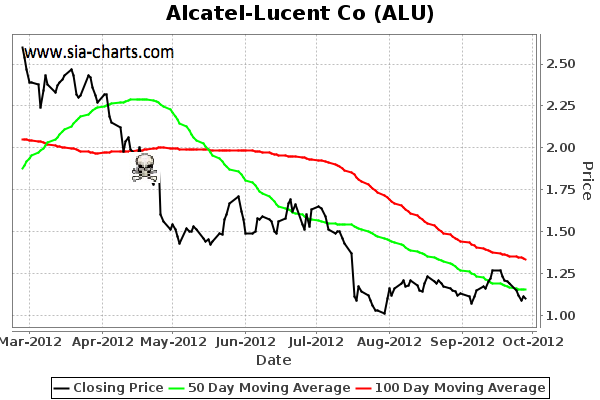
SIA-Chart on ALU : Very Bearish : Besides having the skull and crossbones show up, which happens when the stock goes 5% below its 100 day moving average. We also have a death cross show up which means that the 50 day moving average has broken below the 100 day moving average, which is also very bearish and means that sellers are coming in big time.
Register for free to join our community of investors and share your ideas. You will also get access to streaming quotes, interactive charts, trades, portfolio, live options flow and more tools.


 News
News  Market Data
  Discover