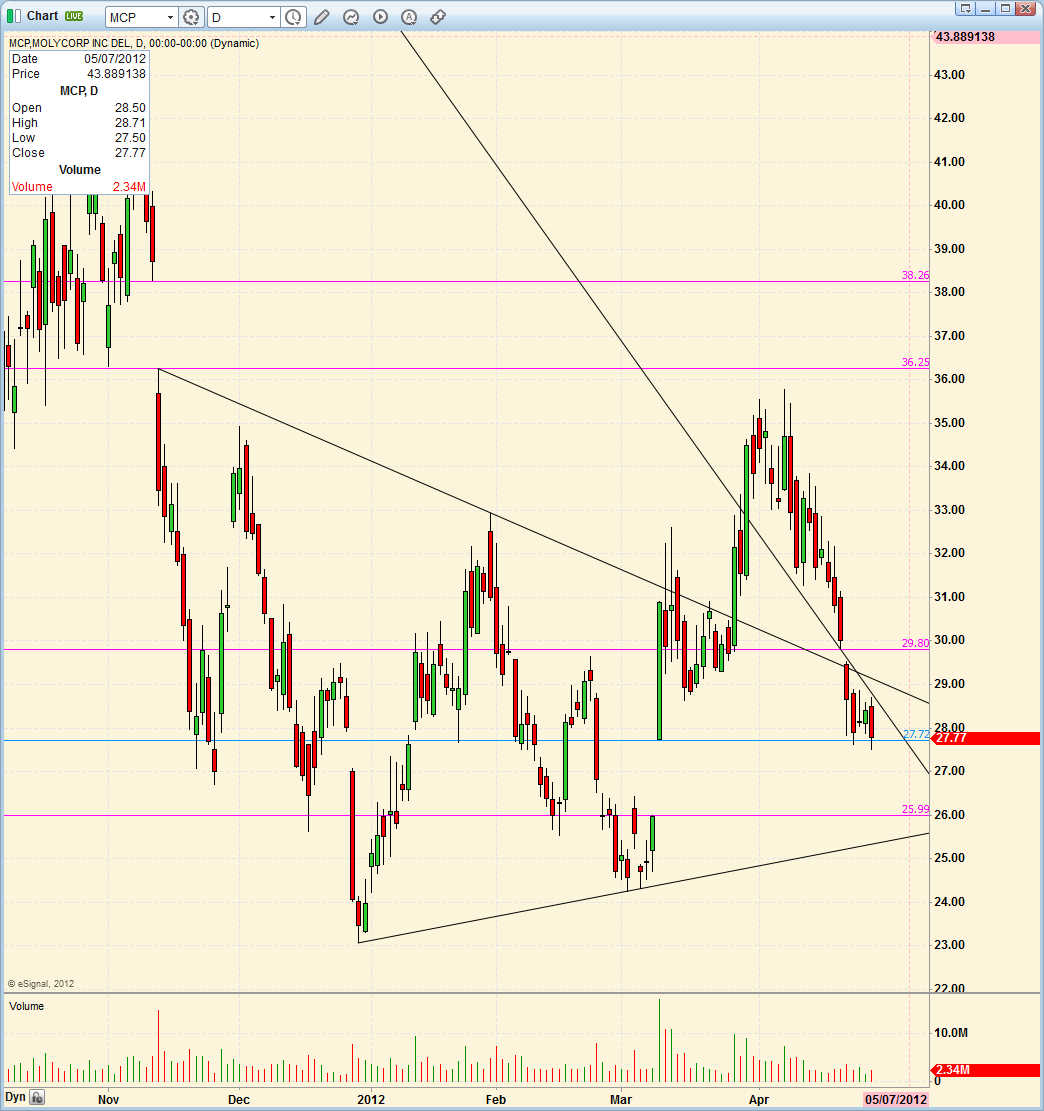
Big picture: The daily interval chart could be forming a double-headed inverted head & shoulders formation. Watch for support at the gap fill at 25.99 and then at the uptrend line below that.
There is much to support the short-term bearish view here: In late March there was a breakout above two downtrend line resistance areas, but the stock has since fallen back below both. The last 4 candles on this chart have formed a bear flag with a weak close last Friday. I fully anticipate the gap at 25.99 to be filled this week.
I do think the 25.30 - $26 range is good buy with a stop just below the previous March low of 24.24. Watch for a pick-up in volume and a slowing rate of decline to help determine the bottom.
Watch for upside resistance at the two downtrend lines and the first overhead gap fill at 29.80. There are two other gaps above at the pink horizontal lines.
Register for free to join our community of investors and share your ideas. You will also get access to streaming quotes, interactive charts, trades, portfolio, live options flow and more tools.
 News
News  Market Data
  Discover