


| Followers | 152 |
| Posts | 11302 |
| Boards Moderated | 0 |
| Alias Born | 03/13/2008 |
Thursday, March 15, 2012 7:34:11 AM
U.S. Treasuries Bubble: Beginning To Burst?
The trade has been talked about by many of the most reputable fund managers. People, including myself in a December 2009 article, have anticipated the top for several years now. Yet those who have been short US Treasuries have been treated to constantly declining yields. For the first time in a long time, increased slack in the Treasury market manifested itself yesterday with yields leaping upward.
A 2.5 standard deviation move in 10yr yields broke the yield above the 200 DMA and was a rare example of Treasuries being more sensitive to the 'risk-on' trade than equities in the past few years. We think this seemingly minor shift in correlation strengths is an indicator of building selling pressure in Treasuries. Treasury yields have lagged as equities have rallied over the past few months, yet the general stabilization in financial markets and the macroeconomy should gradually begin to take its toll on UST demand over the course of 2012.
To be sure, not all signals have turned green, though that should be good news if you're looking for an entry point. As more signals begin to point against Treasuries, they will serve as price catalysts and confirmation that the trade is playing out as expected. Here are two time series, the first of the 30 yr bond and the second of the 10 yr note, showing the massive secular downtrend in UST yields over the past 5 decades.
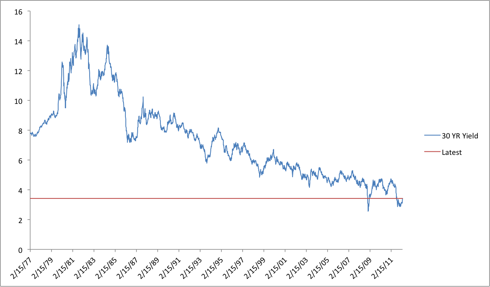
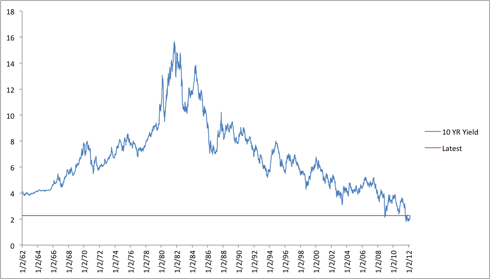
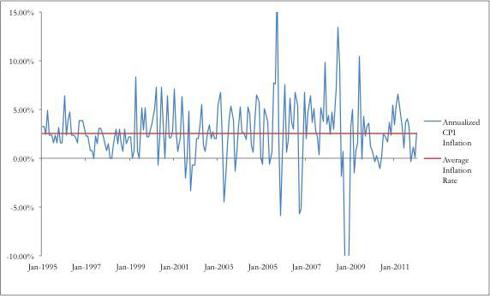
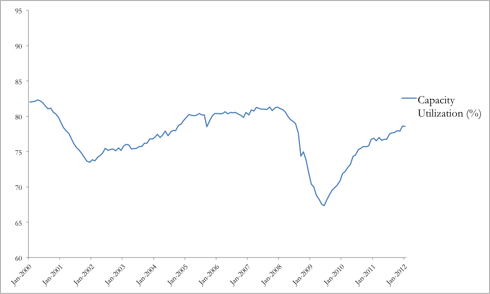
Theoretically, the price floor is a 0% yield, though in actuality inflation will cause nominal yields of about 2% to be real yields of 0%. We are extremely close to negative yields on the 10 yr and investors in Treasuries of all maturities are getting an insulting level of compensation for lending their money to the US government. As inflation returns to normal levels, capacity utilization returns to pre-recession 'normal' levels, and employment begins to pick up, money will inevitably flow from a multi-year hibernation in USTs back to the equity market.
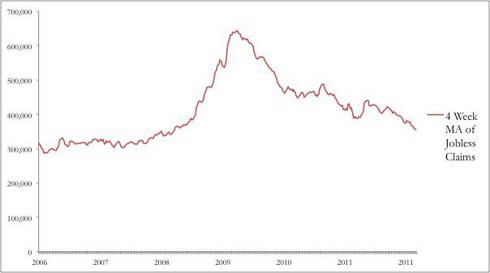
Below are some long-term charts of Annualized CPI, Capacity Utilization, and the 4-week Moving Average of Weekly Jobless Claims. Observe that all three charts are in the process of returning to pre-recessionary levels.
Though investors in the short-UST trade have been disappointed by a number of 'false starts' over the past 3 years, we are confident that the stabilization of the US economy will begin to put a bid into Treasury risk premiums. US economic data hasn't been the only thing hurting Treasuries. Last week's relatively benign Greek default and restructuring has credibly shown investors that European officials are dedicated and able to resolve peripheral debt problems without disorderly outcomes.
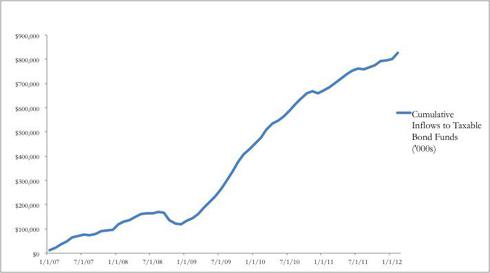
Observe the relatively calm response in the Spanish and Italian bond markets that followed ISDA's announcement of a Greek CDS payout. As uncertainty resolves itself, the safety trade underlying Treasury demand will begin to unwind. The accumulation of fund flows into mutual funds invested in taxable bonds has begun to peak. Observe the declining 2nd derivative:
The strange undercurrents of the past few days in the UST market may be harbingers of coming price action. Our favorite way to play the trade is a position in the levered ETF TBT which is built to perform roughly two times the inverse of the longer end of the UST curve. Since rate increases should hit the longer maturities harder, and because the eventual withdrawal of the Fed's Operation Twist should accelerate the effect of rate increases, we prefer to bet against the outer maturities.
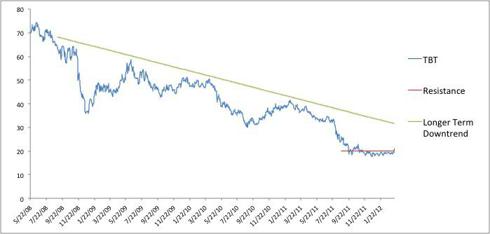
Another option we are less interested in is the PST, which is a levered short of 7-10yr weighted average maturities. Below is a chart of the TBT, which broke above the technically important $20 level yesterday. Note that a break above the longer term down trend (perhaps in the neighborhood of $30) should signal a confirmation that a turnaround in the Treasury market is occurring.
We see two key risks to the short Treasuries thesis. First, the trade could play out over too lengthy a timeframe for the position to meaningfully outperform. As you see in the charts at the top of the page, the decline in yields has been a two generation event and there is a chance that large price movements might only take place at very lengthy increments.
Further, despite the fact we've endured a 3 year bottoming period, it's obviously possible that there could be several years ahead of low yields. We continue to think this is unlikely simply because of the radical divergence between bonds and the equity markets over the past year. While equities have 're-risked', bonds have been stuck in the basement.
These kinds of disjunctions tend to resolve themselves in a speedy manner. As investors realize that the US economy has turned the corner and Europe becomes less of a headline threat, we expect to see a semi-panicked drop down in UST prices sometime this year. Beyond this initial movement, further action on the position might take longer to manifest.
The other main risk is that Baby Boomer fund flows continue to drive demand for USTs and facilitate continued divergence from equities over the next 5-10 years. As Baby Boomers de-risk their retirement portfolios, bonds may be the beneficiaries. We view this as unlikely mainly because the amount of funds flowing out of Treasuries (as the temporary safety trade of the past few years reverses) should outweigh the portfolio readjustment inflows from Baby Boomers.
http://seekingalpha.com/article/435411-u-s-treasuries-bubble-beginning-to-burst
The trade has been talked about by many of the most reputable fund managers. People, including myself in a December 2009 article, have anticipated the top for several years now. Yet those who have been short US Treasuries have been treated to constantly declining yields. For the first time in a long time, increased slack in the Treasury market manifested itself yesterday with yields leaping upward.
A 2.5 standard deviation move in 10yr yields broke the yield above the 200 DMA and was a rare example of Treasuries being more sensitive to the 'risk-on' trade than equities in the past few years. We think this seemingly minor shift in correlation strengths is an indicator of building selling pressure in Treasuries. Treasury yields have lagged as equities have rallied over the past few months, yet the general stabilization in financial markets and the macroeconomy should gradually begin to take its toll on UST demand over the course of 2012.
To be sure, not all signals have turned green, though that should be good news if you're looking for an entry point. As more signals begin to point against Treasuries, they will serve as price catalysts and confirmation that the trade is playing out as expected. Here are two time series, the first of the 30 yr bond and the second of the 10 yr note, showing the massive secular downtrend in UST yields over the past 5 decades.


Theoretically, the price floor is a 0% yield, though in actuality inflation will cause nominal yields of about 2% to be real yields of 0%. We are extremely close to negative yields on the 10 yr and investors in Treasuries of all maturities are getting an insulting level of compensation for lending their money to the US government. As inflation returns to normal levels, capacity utilization returns to pre-recession 'normal' levels, and employment begins to pick up, money will inevitably flow from a multi-year hibernation in USTs back to the equity market.
Below are some long-term charts of Annualized CPI, Capacity Utilization, and the 4-week Moving Average of Weekly Jobless Claims. Observe that all three charts are in the process of returning to pre-recessionary levels.


Though investors in the short-UST trade have been disappointed by a number of 'false starts' over the past 3 years, we are confident that the stabilization of the US economy will begin to put a bid into Treasury risk premiums. US economic data hasn't been the only thing hurting Treasuries. Last week's relatively benign Greek default and restructuring has credibly shown investors that European officials are dedicated and able to resolve peripheral debt problems without disorderly outcomes.
Observe the relatively calm response in the Spanish and Italian bond markets that followed ISDA's announcement of a Greek CDS payout. As uncertainty resolves itself, the safety trade underlying Treasury demand will begin to unwind. The accumulation of fund flows into mutual funds invested in taxable bonds has begun to peak. Observe the declining 2nd derivative:

The strange undercurrents of the past few days in the UST market may be harbingers of coming price action. Our favorite way to play the trade is a position in the levered ETF TBT which is built to perform roughly two times the inverse of the longer end of the UST curve. Since rate increases should hit the longer maturities harder, and because the eventual withdrawal of the Fed's Operation Twist should accelerate the effect of rate increases, we prefer to bet against the outer maturities.
Another option we are less interested in is the PST, which is a levered short of 7-10yr weighted average maturities. Below is a chart of the TBT, which broke above the technically important $20 level yesterday. Note that a break above the longer term down trend (perhaps in the neighborhood of $30) should signal a confirmation that a turnaround in the Treasury market is occurring.

We see two key risks to the short Treasuries thesis. First, the trade could play out over too lengthy a timeframe for the position to meaningfully outperform. As you see in the charts at the top of the page, the decline in yields has been a two generation event and there is a chance that large price movements might only take place at very lengthy increments.
Further, despite the fact we've endured a 3 year bottoming period, it's obviously possible that there could be several years ahead of low yields. We continue to think this is unlikely simply because of the radical divergence between bonds and the equity markets over the past year. While equities have 're-risked', bonds have been stuck in the basement.
These kinds of disjunctions tend to resolve themselves in a speedy manner. As investors realize that the US economy has turned the corner and Europe becomes less of a headline threat, we expect to see a semi-panicked drop down in UST prices sometime this year. Beyond this initial movement, further action on the position might take longer to manifest.
The other main risk is that Baby Boomer fund flows continue to drive demand for USTs and facilitate continued divergence from equities over the next 5-10 years. As Baby Boomers de-risk their retirement portfolios, bonds may be the beneficiaries. We view this as unlikely mainly because the amount of funds flowing out of Treasuries (as the temporary safety trade of the past few years reverses) should outweigh the portfolio readjustment inflows from Baby Boomers.
http://seekingalpha.com/article/435411-u-s-treasuries-bubble-beginning-to-burst
Join the InvestorsHub Community
Register for free to join our community of investors and share your ideas. You will also get access to streaming quotes, interactive charts, trades, portfolio, live options flow and more tools.

