


Saturday, February 25, 2012 10:04:25 PM
IAMLEGEND STOCK LESSON #17 #18 ~ Moving Averages-Crossovers & Divergence~


~~link back for more lessons~~
Moving Averages - Simple and Exponential
Moving averages are used to emphasize the direction of a trend and to smooth out price and volume fluctuations, or "noise", that can confuse interpretation. Typically, upward momentum is confirmed when a short-term average (e.g.15-day) crosses above a longer-term average (e.g. 50-day). Downward momentum is confirmed when a short-term average crosses below a long-term average.
They do not predict price direction, but rather define the current direction with a lag. Moving averages lag because they are based on past prices. Despite this lag, moving averages help smooth price action and filter out the noise. They also form the building blocks for many other technical indicators and overlays, such as Bollinger Bands, MACD and the McClellan Oscillator. The two most popular types of moving averages are the Simple Moving Average (SMA) and the Exponential Moving Average (EMA). These moving averages can be used to identify the direction of the trend or define potential support and resistance levels.


Simple Moving Average
A simple moving average is formed by computing the average price of a security over a specific number of periods. Most moving averages are based on closing prices. A 5-day simple moving average is the five day sum of closing prices divided by five. As its name implies, a moving average is an average that moves. Old data is dropped as new data comes available. This causes the average to move along the time scale. Below is an example of a 5-day moving average evolving over three days.
Exponential Moving Average
Exponential moving averages reduce the lag by applying more weight to recent prices. The weighting applied to the most recent price depends on the number of periods in the moving average. There are three steps to calculating an exponential moving average. First, calculate the simple moving average. An exponential moving average (EMA) has to start somewhere so a simple moving average is used as the previous period's EMA in the first calculation. Second, calculate the weighting multiplier. Third, calculate the exponential moving average. The formula below is for a 10-day EMA.
The longer the moving average, the more the lag. A 10-day exponential moving average will hug prices quite closely and turn shortly after prices turn. Short moving averages are like speed boats - nimble and quick to change. In contrast, a 100-day moving average contains lots of past data that slows it down. Longer moving averages are like ocean tankers - lethargic and slow to change. It takes a larger and longer price movement for a 100-day moving average to change course.

Difference between Simple vs Exponential Moving Averages
Even though there are clear differences between simple moving averages and exponential moving averages, one is not necessarily better than the other. Exponential moving averages have less lag and are therefore more sensitive to recent prices - and recent price changes. Exponential moving averages will turn before simple moving averages. Simple moving averages, on the other hand, represent a true average of prices for the entire time period. As such, simple moving averages may be better suited to identify support or resistance levels.

Types of Moving avg
Short moving averages (5-20 periods) are best suited for short-term trends and trading. Chartists interested in medium-term trends would opt for longer moving averages that might extend 20-60 periods. Long-term investors will prefer moving averages with 100 or more periods.
Some moving average lengths are more popular than others. The 200-day moving average is perhaps the most popular. Because of its length, this is clearly a long-term moving average. Next, the 50-day moving average is quite popular for the medium-term trend. Many chartists use the 50-day and 200-day moving averages together. Short-term, a 10-day moving average was quite popular in the past because it was easy to calculate.


Trend Identification
The direction of the moving average conveys important information about prices. A rising moving average shows that prices are generally increasing. A falling moving average indicates that prices, on average, are falling. A rising long-term moving average reflects a long-term uptrend. A falling long-term moving average reflects a long-term downtrend.

VIDEO-MOVING AVERAGES
http://www.youtube.com/watch?v=M9J4_b8iELw
PART 1. http://www.youtube.com/watch?v=gw-1AhbYP8Q
PART 2. http://www.youtube.com/watch?v=25WiPIndXtA&feature=relmfu
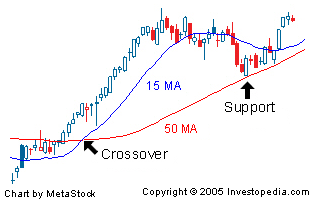
Double Crossovers
Two moving averages can be used together to generate crossover signals. In Technical Analysis of the Financial Markets. Double crossovers involve one relatively short moving average and one relatively long moving average. As with all moving averages, the general length of the moving average defines the timeframe for the system. A system using a 5-day EMA and 35-day EMA would be deemed short-term. A system using a 50-day SMA and 200-day SMA would be deemed medium-term, perhaps even long-term.
A bullish crossover occurs when the shorter moving average crosses above the longer moving average. This is also known as a golden cross. A bearish crossover occurs when the shorter moving average crosses below the longer moving average. This is known as a dead cross.
Moving average crossovers produce relatively late signals. After all, the system employs two lagging indicators. The longer the moving average periods, the greater the lag in the signals. These signals work great when a good trend takes hold. However, a moving average crossover system will produce lots of whipsaws in the absence of a strong trend.
There is also a triple crossover method that involves three moving averages. Again, a signal is generated when the shortest moving average crosses the two longer moving averages. A simple triple crossover system might involve 5-day, 10-day and 20-day moving averages.

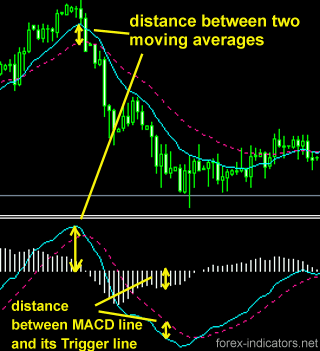
There are two takeaways here. First, crossovers are prone to whipsaw. A price or time filter can be applied to help prevent whipsaws. Traders might require the crossover to last 3 days before acting or require the 10-day EMA to move above/below the 50-day EMA by a certain amount before acting. Second, MACD can be used to identify and quantify these crossovers. MACD (10,50,1) will show a line representing the difference between the two exponential moving averages. MACD turns positive during a golden cross and negative during a dead cross. The Percentage Price Oscillator (PPO) can be used the same way to show percentage differences. Note that MACD and the PPO are based on exponential moving averages and will not match up with simple moving averages.


Price Crossovers


Moving averages can also be used to generate signals with simple price crossovers. A bullish signal is generated when prices move above the moving average. A bearish signal is generated when prices move below the moving average. Price crossovers can be combined to trade within the bigger trend. The longer moving average sets the tone for the bigger trend and the shorter moving average is used to generate the signals. One would look for bullish price crosses only when prices are already above the longer moving average. This would be trading in harmony with the bigger trend. For example, if price is above the 200-day moving average, chartists would only focus on signals when price moves above the 50-day moving average. Obviously, a move below the 50-day moving average would precede such a signal, but such bearish crosses would be ignored because the bigger trend is up. A bearish cross would simply suggest a pullback within a bigger uptrend. A cross back above the 50-day moving average would signal an upturn in prices and continuation of the bigger uptrend.


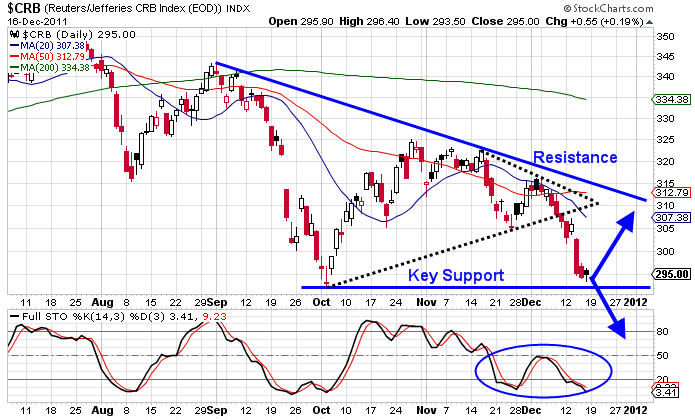
Support and Resistance
Moving averages can also act as support in an uptrend and resistance in a downtrend. A short-term uptrend might find support near the 20-day simple moving average, which is also used in Bollinger Bands. A long-term uptrend might find support near the 200-day simple moving average, which is the most popular long-term moving average. If fact, the 200-day moving average may offer support or resistance simply because it is so widely used. It is almost like a self-fulfilling prophecy.


-------------------------------------------------------------------------------------------------------------------------------------
~~Divergence ~~
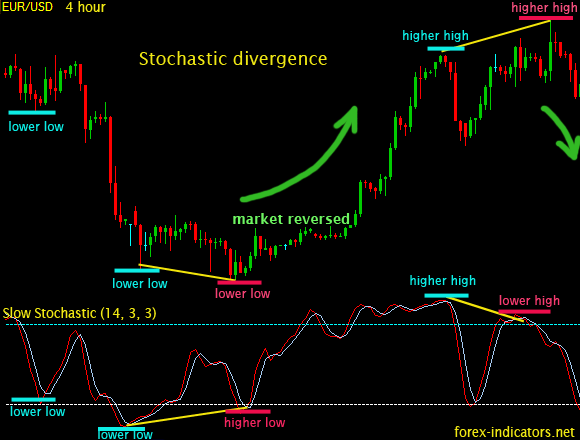
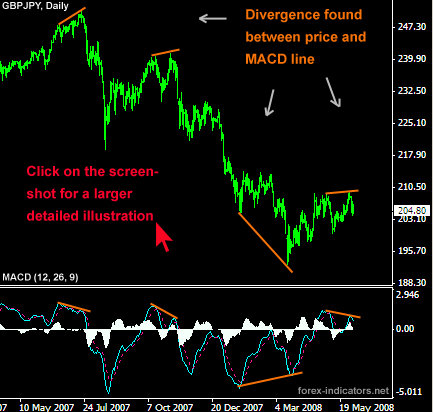
Divergence is a situation that occurs when two lines on a chart move in opposite directions vertically. People often look for divergences by comparing a stock's direction to the direction of its RSI, its MACD or its Stochastic Oscillator. There are two kinds of divergences: positive and negative. A positive divergence occurs when the indicator moves higher while the stock is declining. A negative divergence occurs when the indicator moves lower while the stock is rising.
More technically, the divergence represents the volume density of the outward flux of a vector field from an infinitesimal volume around a given point. For example, consider air as it is heated or cooled. The relevant vector field for this example is the velocity of the moving air at a point. If air is heated in a region it will expand in all directions such that the velocity field points outward from that region. Therefore the divergence of the velocity field in that region would have a positive value, as the region is a source. If the air cools and contracts, the divergence is negative and the region is called a sink.
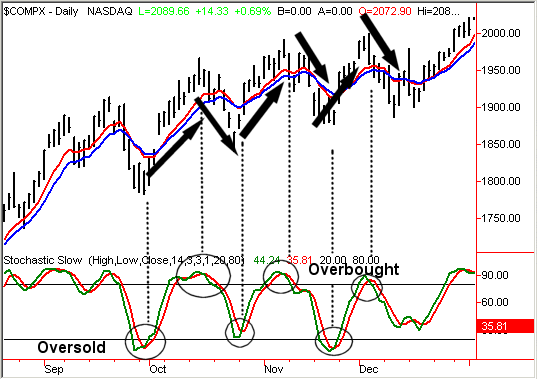
Divergence trading can be used on many indicators -- Stochastic, MACD, RSI and CCI to name a few. As with most indicators, divergence signals in a higher time frame (TF) are going to indicate a larger move in price. The chart examples are going to be comparing price with the Stochastic and MACD indicators. Each chart has the 50EMA (Blue), 200EMA (Red), 9/3/3 Stochastic and the 7/10/5 MACD histogram on it. There are many other Stochastic and MACD settings that also work for divergence signals.

TYPES OF DIVERGENCE
[img]
 [/img]
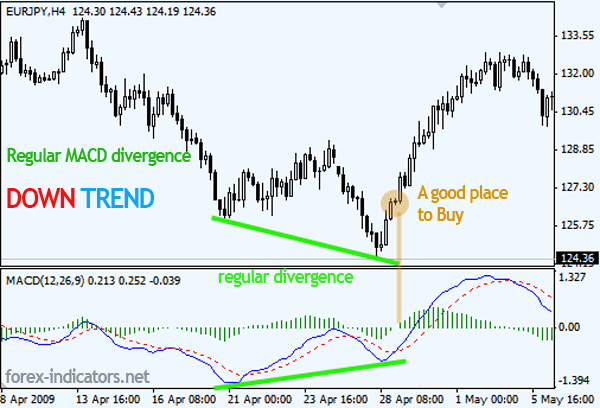
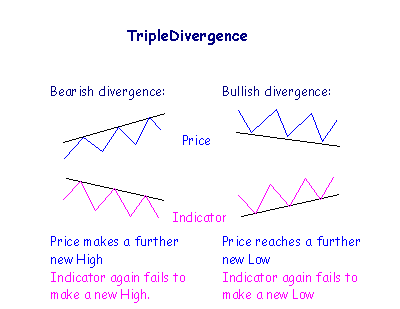
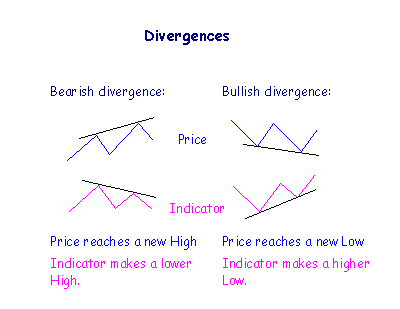
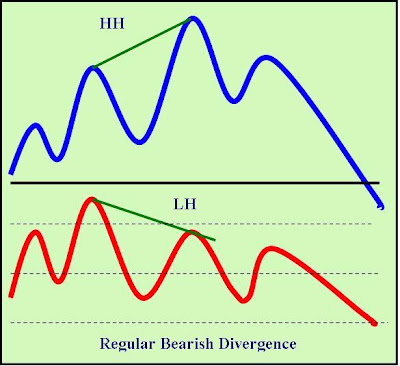
A. Regular Divergence:
1.Higher highs in price and lower highs in the oscillator which indicate a trend reversal from up to down.
2.Lower lows in price and higher lows in the oscillator which indicate a trend reversal from down to up.


B. Hidden Divergence:
1.Lower highs in price and higher highs in the oscillator which indicate a confirmation of the price trend which is down.
2.Higher lows in price and lower lows in the oscillator which indicate a confirmation of the price trend which is up.


[img][/img]
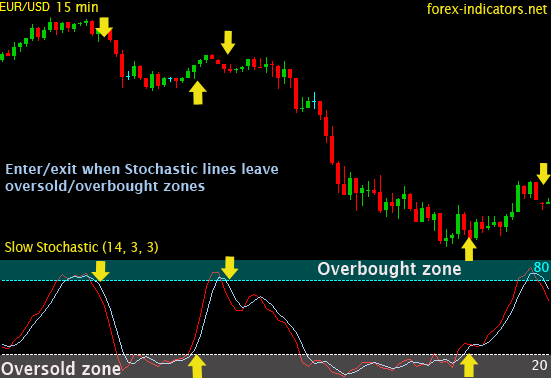
FULL Stochastic Divergence


VIDEO-DIVERGANCE
http://www.youtube.com/watch?v=UFkthbyJWNs&feature=player_embedded#!
http://www.youtube.com/watch?v=PB_ul-3gvDw&feature=related
EXAMPLES


~~link back for more lessons~~
Moving Averages - Simple and Exponential
Moving averages are used to emphasize the direction of a trend and to smooth out price and volume fluctuations, or "noise", that can confuse interpretation. Typically, upward momentum is confirmed when a short-term average (e.g.15-day) crosses above a longer-term average (e.g. 50-day). Downward momentum is confirmed when a short-term average crosses below a long-term average.

They do not predict price direction, but rather define the current direction with a lag. Moving averages lag because they are based on past prices. Despite this lag, moving averages help smooth price action and filter out the noise. They also form the building blocks for many other technical indicators and overlays, such as Bollinger Bands, MACD and the McClellan Oscillator. The two most popular types of moving averages are the Simple Moving Average (SMA) and the Exponential Moving Average (EMA). These moving averages can be used to identify the direction of the trend or define potential support and resistance levels.


Simple Moving Average
A simple moving average is formed by computing the average price of a security over a specific number of periods. Most moving averages are based on closing prices. A 5-day simple moving average is the five day sum of closing prices divided by five. As its name implies, a moving average is an average that moves. Old data is dropped as new data comes available. This causes the average to move along the time scale. Below is an example of a 5-day moving average evolving over three days.
Exponential Moving Average
Exponential moving averages reduce the lag by applying more weight to recent prices. The weighting applied to the most recent price depends on the number of periods in the moving average. There are three steps to calculating an exponential moving average. First, calculate the simple moving average. An exponential moving average (EMA) has to start somewhere so a simple moving average is used as the previous period's EMA in the first calculation. Second, calculate the weighting multiplier. Third, calculate the exponential moving average. The formula below is for a 10-day EMA.
The longer the moving average, the more the lag. A 10-day exponential moving average will hug prices quite closely and turn shortly after prices turn. Short moving averages are like speed boats - nimble and quick to change. In contrast, a 100-day moving average contains lots of past data that slows it down. Longer moving averages are like ocean tankers - lethargic and slow to change. It takes a larger and longer price movement for a 100-day moving average to change course.

Difference between Simple vs Exponential Moving Averages
Even though there are clear differences between simple moving averages and exponential moving averages, one is not necessarily better than the other. Exponential moving averages have less lag and are therefore more sensitive to recent prices - and recent price changes. Exponential moving averages will turn before simple moving averages. Simple moving averages, on the other hand, represent a true average of prices for the entire time period. As such, simple moving averages may be better suited to identify support or resistance levels.

Types of Moving avg
Short moving averages (5-20 periods) are best suited for short-term trends and trading. Chartists interested in medium-term trends would opt for longer moving averages that might extend 20-60 periods. Long-term investors will prefer moving averages with 100 or more periods.
Some moving average lengths are more popular than others. The 200-day moving average is perhaps the most popular. Because of its length, this is clearly a long-term moving average. Next, the 50-day moving average is quite popular for the medium-term trend. Many chartists use the 50-day and 200-day moving averages together. Short-term, a 10-day moving average was quite popular in the past because it was easy to calculate.


Trend Identification
The direction of the moving average conveys important information about prices. A rising moving average shows that prices are generally increasing. A falling moving average indicates that prices, on average, are falling. A rising long-term moving average reflects a long-term uptrend. A falling long-term moving average reflects a long-term downtrend.

VIDEO-MOVING AVERAGES
http://www.youtube.com/watch?v=M9J4_b8iELw
PART 1. http://www.youtube.com/watch?v=gw-1AhbYP8Q
PART 2. http://www.youtube.com/watch?v=25WiPIndXtA&feature=relmfu
Double Crossovers
Two moving averages can be used together to generate crossover signals. In Technical Analysis of the Financial Markets. Double crossovers involve one relatively short moving average and one relatively long moving average. As with all moving averages, the general length of the moving average defines the timeframe for the system. A system using a 5-day EMA and 35-day EMA would be deemed short-term. A system using a 50-day SMA and 200-day SMA would be deemed medium-term, perhaps even long-term.
A bullish crossover occurs when the shorter moving average crosses above the longer moving average. This is also known as a golden cross. A bearish crossover occurs when the shorter moving average crosses below the longer moving average. This is known as a dead cross.
Moving average crossovers produce relatively late signals. After all, the system employs two lagging indicators. The longer the moving average periods, the greater the lag in the signals. These signals work great when a good trend takes hold. However, a moving average crossover system will produce lots of whipsaws in the absence of a strong trend.
There is also a triple crossover method that involves three moving averages. Again, a signal is generated when the shortest moving average crosses the two longer moving averages. A simple triple crossover system might involve 5-day, 10-day and 20-day moving averages.

There are two takeaways here. First, crossovers are prone to whipsaw. A price or time filter can be applied to help prevent whipsaws. Traders might require the crossover to last 3 days before acting or require the 10-day EMA to move above/below the 50-day EMA by a certain amount before acting. Second, MACD can be used to identify and quantify these crossovers. MACD (10,50,1) will show a line representing the difference between the two exponential moving averages. MACD turns positive during a golden cross and negative during a dead cross. The Percentage Price Oscillator (PPO) can be used the same way to show percentage differences. Note that MACD and the PPO are based on exponential moving averages and will not match up with simple moving averages.


Price Crossovers


Moving averages can also be used to generate signals with simple price crossovers. A bullish signal is generated when prices move above the moving average. A bearish signal is generated when prices move below the moving average. Price crossovers can be combined to trade within the bigger trend. The longer moving average sets the tone for the bigger trend and the shorter moving average is used to generate the signals. One would look for bullish price crosses only when prices are already above the longer moving average. This would be trading in harmony with the bigger trend. For example, if price is above the 200-day moving average, chartists would only focus on signals when price moves above the 50-day moving average. Obviously, a move below the 50-day moving average would precede such a signal, but such bearish crosses would be ignored because the bigger trend is up. A bearish cross would simply suggest a pullback within a bigger uptrend. A cross back above the 50-day moving average would signal an upturn in prices and continuation of the bigger uptrend.


Support and Resistance
Moving averages can also act as support in an uptrend and resistance in a downtrend. A short-term uptrend might find support near the 20-day simple moving average, which is also used in Bollinger Bands. A long-term uptrend might find support near the 200-day simple moving average, which is the most popular long-term moving average. If fact, the 200-day moving average may offer support or resistance simply because it is so widely used. It is almost like a self-fulfilling prophecy.


-------------------------------------------------------------------------------------------------------------------------------------
~~Divergence ~~
Divergence is a situation that occurs when two lines on a chart move in opposite directions vertically. People often look for divergences by comparing a stock's direction to the direction of its RSI, its MACD or its Stochastic Oscillator. There are two kinds of divergences: positive and negative. A positive divergence occurs when the indicator moves higher while the stock is declining. A negative divergence occurs when the indicator moves lower while the stock is rising.
More technically, the divergence represents the volume density of the outward flux of a vector field from an infinitesimal volume around a given point. For example, consider air as it is heated or cooled. The relevant vector field for this example is the velocity of the moving air at a point. If air is heated in a region it will expand in all directions such that the velocity field points outward from that region. Therefore the divergence of the velocity field in that region would have a positive value, as the region is a source. If the air cools and contracts, the divergence is negative and the region is called a sink.
Divergence trading can be used on many indicators -- Stochastic, MACD, RSI and CCI to name a few. As with most indicators, divergence signals in a higher time frame (TF) are going to indicate a larger move in price. The chart examples are going to be comparing price with the Stochastic and MACD indicators. Each chart has the 50EMA (Blue), 200EMA (Red), 9/3/3 Stochastic and the 7/10/5 MACD histogram on it. There are many other Stochastic and MACD settings that also work for divergence signals.

TYPES OF DIVERGENCE
[img]
 [/img]
 A. Regular Divergence:
1.Higher highs in price and lower highs in the oscillator which indicate a trend reversal from up to down.
2.Lower lows in price and higher lows in the oscillator which indicate a trend reversal from down to up.


B. Hidden Divergence:
1.Lower highs in price and higher highs in the oscillator which indicate a confirmation of the price trend which is down.
2.Higher lows in price and lower lows in the oscillator which indicate a confirmation of the price trend which is up.


[img][/img]
FULL Stochastic Divergence


VIDEO-DIVERGANCE
http://www.youtube.com/watch?v=UFkthbyJWNs&feature=player_embedded#!
http://www.youtube.com/watch?v=PB_ul-3gvDw&feature=related
EXAMPLES


Join the InvestorsHub Community
Register for free to join our community of investors and share your ideas. You will also get access to streaming quotes, interactive charts, trades, portfolio, live options flow and more tools.

