


Sunday, February 19, 2012 10:59:39 PM
~IAMLEGEND LESSON OF THE DAY!!! ~INTRA DAY TRADING CHARTS~
~~link back for more lessons~~

'GoodFellas $tock Mafia Plays'
http://investorshub.advfn.com/boards/board.aspx?board_id=23057
An intraday stock chart is simply a chart that displays information for time-frames shorter than a day. For most traders this includes 1, 5, 15 and 60 minute charts. Also, if you’re trading a market that trades 24 hours a day, like the Forex, a frequently used intraday chart is the 240 minute (or 4 hours, for the mathematically challenged). Using these charts, day traders are able to make decisions based on where the price has been. It is common for traders to use intraday charts in multiple time-frames when trading. You should stick to 1 minute or 5 minute charts, and only trade off of one of them, depending on the time of day. When not actively trading you can scan through 1, 5 and 60 minute charts to keep an eye on the whole picture.

Fortunately, candlestick signals clearly illustrate the change in investor sentiment for any time period; monthly, weekly, daily, hourly or by the minutes. A minute chart is valuable for the day trading technique. Combining stochastics with candlestick signals, even on a minute to minute basis, produces highly accurate results. Day trading has a very viable platform to work from when the signals and stochastics coordinate.
Producing the right combination of time segments can formulate low-risk, high potential day trading setups. For example, the active day trader may use the 1 minute, 3 minute and 10 minute charts to establish their trades. The 1 minute, 5 minute and 15 minute chart combination works extremely well. Other day trading programs, set for two or three trades per day, may use the 5 minute, 15 minute, one-hour combination.
Combining multiple charts creates a basis for catching the intraday trends. Day trading in this manner requires getting in and getting out of trades right at the reversal points. The candlestick signals provide this information. Daytrading without a method to take advantage of accurate reversal signals produces much reduced profits. Daytraders should utilize candlestick stock analysis for clear entry and exit strategies.
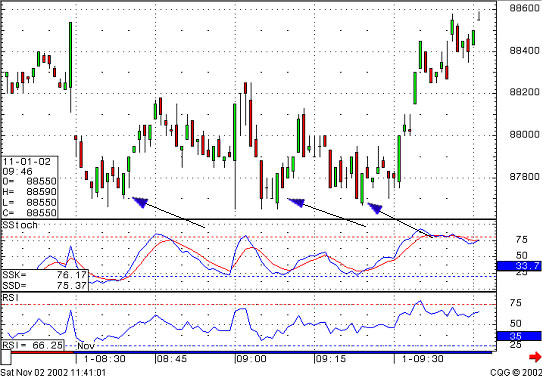
1-Min chart
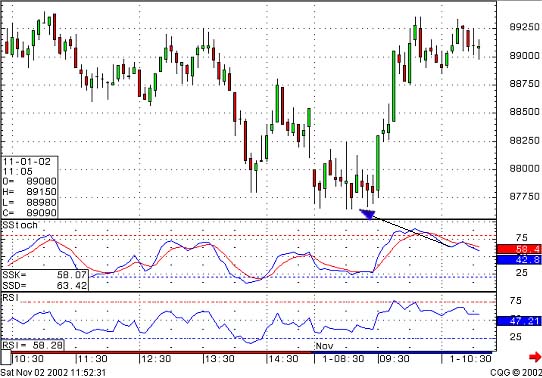
5-Min Chart
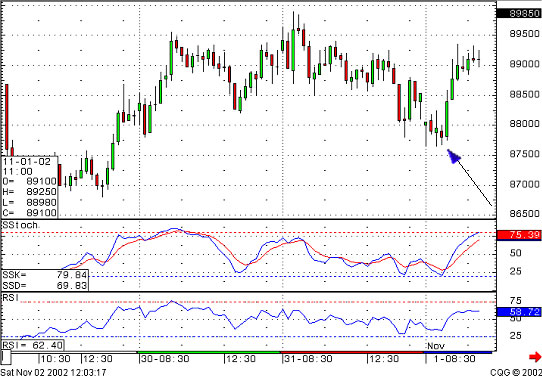
15-Min Chart
The first thing you should do when trading intraday regardless of the security is to have some general idea of where the market has been recently. You cannot of course start the day with a strong directional bias. The reason you cannot start the day with a strong bias is that intraday the markets can be very volatile and if you have stubbornly decided the market will go one way and it starts to go another you will find it difficult to change direction. This is because you will try and convince yourself that the move against you is temporary.
As openings can be volatile I like to watch the first 30 minutes to 60 minutes to see how the market is shaping up before taking a position.
The one thing you shouldn't do is wake up thinking that the market is going up (or down) and just keeps trading in that direction. Don't fight the market, it will always win. Just go with the flow and realize when you are not going your way.
VIDEO-Intraday Stock Trading
EXAMPLES


~~link back for more lessons~~

'GoodFellas $tock Mafia Plays'
http://investorshub.advfn.com/boards/board.aspx?board_id=23057
An intraday stock chart is simply a chart that displays information for time-frames shorter than a day. For most traders this includes 1, 5, 15 and 60 minute charts. Also, if you’re trading a market that trades 24 hours a day, like the Forex, a frequently used intraday chart is the 240 minute (or 4 hours, for the mathematically challenged). Using these charts, day traders are able to make decisions based on where the price has been. It is common for traders to use intraday charts in multiple time-frames when trading. You should stick to 1 minute or 5 minute charts, and only trade off of one of them, depending on the time of day. When not actively trading you can scan through 1, 5 and 60 minute charts to keep an eye on the whole picture.

Fortunately, candlestick signals clearly illustrate the change in investor sentiment for any time period; monthly, weekly, daily, hourly or by the minutes. A minute chart is valuable for the day trading technique. Combining stochastics with candlestick signals, even on a minute to minute basis, produces highly accurate results. Day trading has a very viable platform to work from when the signals and stochastics coordinate.
Producing the right combination of time segments can formulate low-risk, high potential day trading setups. For example, the active day trader may use the 1 minute, 3 minute and 10 minute charts to establish their trades. The 1 minute, 5 minute and 15 minute chart combination works extremely well. Other day trading programs, set for two or three trades per day, may use the 5 minute, 15 minute, one-hour combination.
Combining multiple charts creates a basis for catching the intraday trends. Day trading in this manner requires getting in and getting out of trades right at the reversal points. The candlestick signals provide this information. Daytrading without a method to take advantage of accurate reversal signals produces much reduced profits. Daytraders should utilize candlestick stock analysis for clear entry and exit strategies.
1-Min chart

5-Min Chart

15-Min Chart

The first thing you should do when trading intraday regardless of the security is to have some general idea of where the market has been recently. You cannot of course start the day with a strong directional bias. The reason you cannot start the day with a strong bias is that intraday the markets can be very volatile and if you have stubbornly decided the market will go one way and it starts to go another you will find it difficult to change direction. This is because you will try and convince yourself that the move against you is temporary.
As openings can be volatile I like to watch the first 30 minutes to 60 minutes to see how the market is shaping up before taking a position.
The one thing you shouldn't do is wake up thinking that the market is going up (or down) and just keeps trading in that direction. Don't fight the market, it will always win. Just go with the flow and realize when you are not going your way.
VIDEO-Intraday Stock Trading
EXAMPLES


* 20% Profit Rule
* Do your DD
* Follow the Charts-Trend
* Stop loss
* Buy at Support,Sell at Resistance
* Dont chase momentum stocks
* Control Fear & Greed
Join the InvestorsHub Community
Register for free to join our community of investors and share your ideas. You will also get access to streaming quotes, interactive charts, trades, portfolio, live options flow and more tools.

