Sunday, July 24, 2005 12:13:23 PM
Broken link. Here's a copy & paste of Babelfish
UPDATE Elliottwaves S&P500-Index
At the end of June still lay the SPX below the resistance of 1.208 points, so that tendentious falling courses were prognosticated. The fast Rebreak of 1.208 neutralized the fresh Short signal, so that the superordinate upward trend was again taken up. The in the meantime new Tops was not particular surprising.
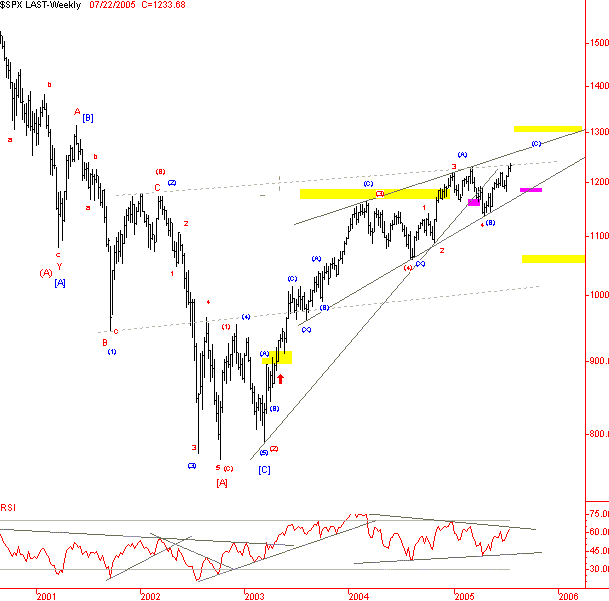
Which concerns the long-term Chart, in principle a Restpotenzial exists upward until approximately 1,300 points for the index, where a on a long-term basis important Retracement lies. Whether the SPX however the strength possesses this price level to reach is rather questionable.
If one looks at oneself the upward motions of the past 18 months, then it is noticeable that the rises of the price extent became ever shorter and the reactions were temporally expanded and/or led to wave overlaps. This is not in the long-term context an indication of the strength. Thus for the time being only one count is applicable as corrective rise.
Illustration 1: Weekly Chart SPX

Picture increase
Which the long-term samples concern, a significant Short signal is necessary, in order to ring in central and/or long-term Downmove. The associated downward goals of 1.060 and/or. 980 points on view of 12 months remain up to then in the drawer; are postponed, but not waived.
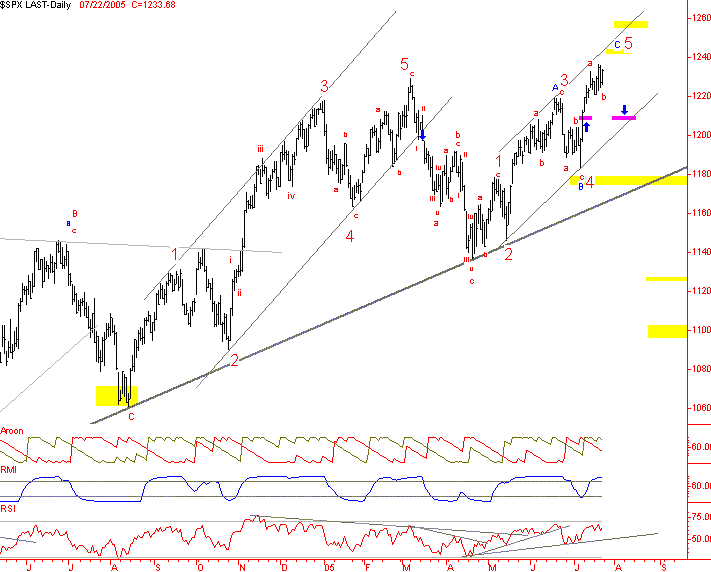
The medium-term central support is momentarily with approximately 1,180+, where a flat boom trend line runs. So for a long time this trend is not hurt, gives it no sound, medium-term negative trend signals. With 1.210 a Short signal is already generated. This is important however only for the kuerzerfristige trend behavior.
Illustration 2: DAILY Chart SPX

Which concerns the samples of the past months, neither a classical upward impulse, nor (assumed like so far) a usual correction sample are present. Correct way are corrective the Patterns starting from the April low. Both the rise to 1,179, and the move to 1,219 were only three wavy! This speaks clearly against a Aufwaertsfuenfer and was also the reason for the expected decrease.
The rise of the past weeks fits therefore not quite into the picture, even if a Flat correction is subordinated. There is actually only a meaningful possibility this upward trend inclusive corrective Patterns abzuzaehlen, i.e. in the framework one diagonally trifishes.
This is a "hermaphrodite", i.e. the wave consists of five single movements, which are in each case corrective however only. Exactly this is for April the case. This diagonally trifishes arises typically in the last final phase central or long-term trend movement, either as Wave v of 5 or wave of a C of a double or a Triple Zigzag.
The rise since 07 July is not correctively countable however yet, because it concerns a magnifying glass-pure impulse. The lateral movement of the past week is clearly corrective and must be counted therefore as intermediate correction within the upward motion. Only a Wave iv or the more probable case, a Wave b of 5 is applicable.
For the trend behavior of the next days and weeks this first far means rising courses. The computational course goals, which result from the wavelengths of the waves 1 and 3, are with 1.243 and 1.257 points. A dynamic expansion until scarcely 1,300 points cannot be derived momentarily.
As soon as the SPX penetrated into the 1.250-er range, the central support can be raised to 1.220 points. Above this mark chart and wave technical are everything in the green range. If this support falls, a medium-term loadable Top is present. Up-to-date this support however still is at 1.210 points.
Result:
It is open, as far the SPX still climbs. A move until over 1.250 points is ideal, so that a mehrmonatige fall of prices starts there. The central support, whose BREAK leads to a strategic Short signal, is at 1.210, later at 1.220 points.
UPDATE Elliottwaves S&P500-Index
At the end of June still lay the SPX below the resistance of 1.208 points, so that tendentious falling courses were prognosticated. The fast Rebreak of 1.208 neutralized the fresh Short signal, so that the superordinate upward trend was again taken up. The in the meantime new Tops was not particular surprising.
Which concerns the long-term Chart, in principle a Restpotenzial exists upward until approximately 1,300 points for the index, where a on a long-term basis important Retracement lies. Whether the SPX however the strength possesses this price level to reach is rather questionable.
If one looks at oneself the upward motions of the past 18 months, then it is noticeable that the rises of the price extent became ever shorter and the reactions were temporally expanded and/or led to wave overlaps. This is not in the long-term context an indication of the strength. Thus for the time being only one count is applicable as corrective rise.
Illustration 1: Weekly Chart SPX

Picture increase
Which the long-term samples concern, a significant Short signal is necessary, in order to ring in central and/or long-term Downmove. The associated downward goals of 1.060 and/or. 980 points on view of 12 months remain up to then in the drawer; are postponed, but not waived.
The medium-term central support is momentarily with approximately 1,180+, where a flat boom trend line runs. So for a long time this trend is not hurt, gives it no sound, medium-term negative trend signals. With 1.210 a Short signal is already generated. This is important however only for the kuerzerfristige trend behavior.
Illustration 2: DAILY Chart SPX

Which concerns the samples of the past months, neither a classical upward impulse, nor (assumed like so far) a usual correction sample are present. Correct way are corrective the Patterns starting from the April low. Both the rise to 1,179, and the move to 1,219 were only three wavy! This speaks clearly against a Aufwaertsfuenfer and was also the reason for the expected decrease.
The rise of the past weeks fits therefore not quite into the picture, even if a Flat correction is subordinated. There is actually only a meaningful possibility this upward trend inclusive corrective Patterns abzuzaehlen, i.e. in the framework one diagonally trifishes.
This is a "hermaphrodite", i.e. the wave consists of five single movements, which are in each case corrective however only. Exactly this is for April the case. This diagonally trifishes arises typically in the last final phase central or long-term trend movement, either as Wave v of 5 or wave of a C of a double or a Triple Zigzag.
The rise since 07 July is not correctively countable however yet, because it concerns a magnifying glass-pure impulse. The lateral movement of the past week is clearly corrective and must be counted therefore as intermediate correction within the upward motion. Only a Wave iv or the more probable case, a Wave b of 5 is applicable.
For the trend behavior of the next days and weeks this first far means rising courses. The computational course goals, which result from the wavelengths of the waves 1 and 3, are with 1.243 and 1.257 points. A dynamic expansion until scarcely 1,300 points cannot be derived momentarily.
As soon as the SPX penetrated into the 1.250-er range, the central support can be raised to 1.220 points. Above this mark chart and wave technical are everything in the green range. If this support falls, a medium-term loadable Top is present. Up-to-date this support however still is at 1.210 points.
Result:
It is open, as far the SPX still climbs. A move until over 1.250 points is ideal, so that a mehrmonatige fall of prices starts there. The central support, whose BREAK leads to a strategic Short signal, is at 1.210, later at 1.220 points.
Gizmo...
Join the InvestorsHub Community
Register for free to join our community of investors and share your ideas. You will also get access to streaming quotes, interactive charts, trades, portfolio, live options flow and more tools.


