


Saturday, July 30, 2011 10:06:33 AM
JUL 30, ’11 1:11 PM
AUTHOR
Horace Dediu
CATEGORIES
Industry
The following chart shows the current profit distribution between phone vendors with an eye toward identifying volume dependencies. The vertical axis represents operating profit per phone and the horizontal axis the number of phones sold.
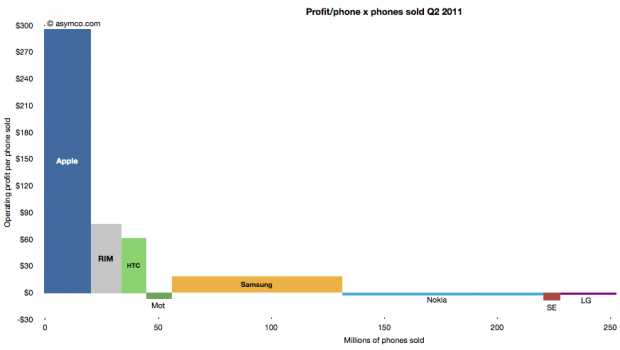
The area of each vendor bar is therefore the total operating profit that vendor captured. A vertical (portrait) orientation implies high profitability with relative low volume while a horizontal (landscape) orientation implies a high volume/low profitability focus.
The other important observation is that bars can also be negative. Those vendors’ names are listed below the bars rather than within them.
http://www.asymco.com/2011/07/30/the-profitphone-x-phones-sold-chart/
Recent AAPL News
- iPhone Sales Skyrocket in China, Nvidia Surges in Pre-Market Following xAI Fundraising, and More News • IH Market News • 05/28/2024 11:37:48 AM
- Nvidia Profits Set to Challenge Historic High Market; GE Aerospace Announces New Hires, and More News • IH Market News • 05/22/2024 10:37:09 AM
- Apple and Île-de-France Mobilités introduce Navigo card for iPhone and Apple Watch • Business Wire • 05/21/2024 03:30:00 PM
- CalPERS to Oppose Exxon Mobil Directors; Microsoft Unveils Copilot+ PCs with AI Focus, and More News • IH Market News • 05/21/2024 11:18:35 AM
- Li Auto Stocks Drop Post Earnings; Calhoun Re-elected to Boeing Board, and More News • IH Market News • 05/20/2024 11:03:22 AM
- Form 4 - Statement of changes in beneficial ownership of securities • Edgar (US Regulatory) • 05/17/2024 10:30:33 PM
- Chubb Stock Soars 9% with Berkshire Acquisition, AST SpaceMobile jumps 37% on AT&T deal, and More News • IH Market News • 05/16/2024 11:27:07 AM
- Apple announces new accessibility features, including Eye Tracking, Music Haptics, and Vocal Shortcuts • Business Wire • 05/15/2024 02:00:00 PM
- Form 4 - Statement of changes in beneficial ownership of securities • Edgar (US Regulatory) • 05/14/2024 10:30:21 PM
- Walmart Corporate Job Cuts and Office Centralization, GameStop and AMC Surge, and More News • IH Market News • 05/14/2024 11:26:02 AM
- Apple Music celebrates the greatest records ever made with the launch of inaugural 100 Best Albums list • Business Wire • 05/13/2024 01:00:00 PM
- Arm Sets 2025 Target for AI Chip Development, Amazon and Microsoft Commit Billions to French Investments, and More • IH Market News • 05/13/2024 11:16:03 AM
- Weekly Surge for Render and Toncoin, US Bancorp Expands Bitcoin ETF Investments, and More in Crypto • IH Market News • 05/10/2024 07:32:06 PM
- Novavax Surges 57% Post $1.4 Billion Sanofi Deal; Apple Boosts Data Centers with AI and Internal Chips, and More News • IH Market News • 05/10/2024 12:02:56 PM
- Bain Capital in Talks to Acquire PowerSchool; Blackstone Emerges Victorious in Hipgnosis Bidding War, and More News • IH Market News • 05/09/2024 11:53:19 AM
- Meta Platforms Expands AI Ads, Apple Boosts iPhone Shipments, and More Highlights • IH Market News • 05/08/2024 12:27:48 PM
- Apple unveils stunning new iPad Pro with the world’s most advanced display, M4 chip, and Apple Pencil Pro • Business Wire • 05/07/2024 02:37:00 PM
- Apple unveils the redesigned 11-inch and all-new 13-inch iPad Air, supercharged by the M2 chip • Business Wire • 05/07/2024 02:37:00 PM
- Apple introduces M4 chip • Business Wire • 05/07/2024 02:37:00 PM
- Final Cut Pro transforms video creation with Live Multicam on iPad and new AI features on Mac • Business Wire • 05/07/2024 02:37:00 PM
- Logic Pro takes music-making to the next level with new AI features • Business Wire • 05/07/2024 02:37:00 PM
- Tesla’s April Sales Down 18% in China, Amazon’s Multi-Billion Dollar Cloud Expansion in Singapore, and More News • IH Market News • 05/07/2024 11:44:00 AM
- Index Futures Point to Strong Monday Opening, Building on Last Week’s Gains; Oil Prices Rise • IH Market News • 05/06/2024 12:09:15 PM
- Perficient Stock Soars 52.9% Post-Acquisition; Luminar Declines 10% Amid Workforce Cutbacks, and Other News • IH Market News • 05/06/2024 12:09:00 PM
- Jobs Data, Apple Earnings Contribute To Extended Rally On Wall Street • IH Market News • 05/03/2024 08:25:49 PM
Green Leaf Innovations, Inc. Engages Olayinka Oyebola & Co for Two-Year Audit • GRLF • May 28, 2024 8:30 AM
HealthLynked Introduces AI-Powered Chat Function to Enhance Healthcare Accessibility • HLYK • May 28, 2024 8:00 AM
Avant Technologies Engages Wired4Tech to Evaluate the Performance of Next Generation AI Server Technology • AVAI • May 23, 2024 8:00 AM
Branded Legacy, Inc. Unveils Collaboration with Celebrity Tattoo Artist Kat Tat for New Tattoo Aftercare Product • BLEG • May 22, 2024 8:30 AM
"Defo's Morning Briefing" Set to Debut for "GreenliteTV" • GRNL • May 21, 2024 2:28 PM
North Bay Resources Announces 50/50 JV at Fran Gold Project, British Columbia; Initiates NI 43-101 Resources Estimate and Bulk Sample • NBRI • May 21, 2024 9:07 AM

