


| Followers | 192 |
| Posts | 41494 |
| Boards Moderated | 1 |
| Alias Born | 10/29/2007 |
Thursday, July 28, 2011 10:59:16 PM
Market Maker Lesson #1...Head Fakes out of Consolidation
The first thing to know about market makers is that they do exist. These are the ones we know as "big money" or the "the big guns". Contrary to popular belief, these guys do run the market. They have already determined before the US open which way they want to take the market for the day. They determine the high and low for the day. They will use things like the news as a means to an end to accomplish these movements. They don't care about fundamentals nor do they care about technical indicators or support or resistance.
Market makers are good at one thing...making money. Whose money? Your money of course. The more stop losses they take out and the more accounts they can margin out, the more they make. People who work as market makers for large financial institutions get paid extra every time they take out one of your stop losses or take out your entire account on a margin call. They're good at scaring you out of your position by taking the market to extreme levels. Then when you've had enough and you close out your losing position, the market seems to magically reverse and move back the way you wanted it to go in the first place.
Market makers know everything we know and more. They know all the chart patterns, the fib levels, and the moving averages that we trade. They know all about Gartleys and Elliott Wave patterns. They know about the lightning bolt pattern where AB= CD. And they know how we expect these things to behave....and they're good at making them NOT behave the way we want them to because they know we can easily get sucked into what we think is a head and shoulders pattern or a final Wave 5 movement or a bearish gartley that's about to reverse any minute. Then they pull the rug out from under us and leave us scratching our head as to why that pattern that worked last week suddenly fell apart this week.
Market makers know one thing that we don't know...they know how many contracts exist on each side of the pair we want to trade. They know, for example, if there's 3 million contracts long on EU vs 1 million short. And they know how to sucker as many of those traders as possible into losing their money on those contracts.
In the late night and early morning hours, we have the Asian session that runs. We've all noticed how that session is basically a paint drying session. It's very often boring and uneventful with small movements throughout the night. That's not always the case but it is the case more often than not.
We also have noticed that the market begins to move in bigger swings after the Asian session closes and the London session comes on line. But do you know why? Have you ever watched the Asian channel closely after it closes?
Let's take a closer look. Check out this diagram.
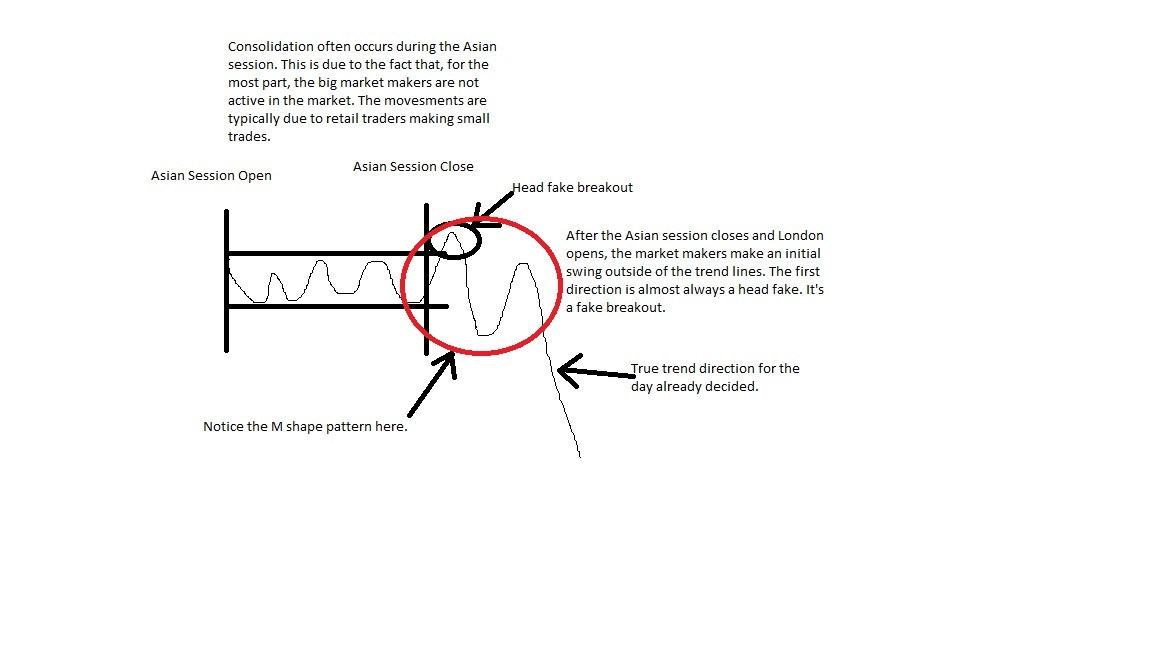
After the Asian session closes and the London session open, the market makers go to work. Their first job is to provide a "head fake" movement that results in a channel break. We've all been there...we see consolidation. Then we see a break either above or below the channel that signals that the market is ready to move further in that direction. We take the trade and then BAM!....the market reverses after a small movement and goes completely the other way. Ever been there? Man, I know I have...more than once.
In this example, the market breaks first to the upside. This does 2 things at once...first, for those who are short the market and have their stop losses set just above the channel top, it takes out all of those stops. Second, it sucks in those who think that this will signal a new bull run to the topside. So now they've taken out the shorts and they've lured in a whole new bevy of longs.
After a small movement topside, they take the market right back down again. These movements are almost always 25 to 50 pips initially. So if you went long and set your stop loss somewhere back down in the channel, you get taken out there. In many instances, those who go long will set their stop losses just below the bottom of the channel. The market makers will many times take the next move down to just below the bottom trend line from the Asian session. That closes out longs who have stop losses there.
Now that the price has swung to the bottom side, we may get some new traders who now decide that they want to short the market since it fell below the previous support. Well, guess what...now it's time to take the market back up again and shake out as many of those short traders as they can.
They've now managed to shake out a ton of retail traders at this point on both ends of the spectrum. These are the whipsaws that kill many traders with multiple head fakes. Again, these movements are typically 25 to 50 pips in any one direction.
After the next move up, the market is finally set up exactly the way the market makers want and they begin to move it in the true direction they want it to go...down. This is where the bigger trend for the day begins. This is typically where the Average Daily Range for the pairs occurs. This movement shakes out the die hards...the ones who were long who didn't set a stop loss or who have a big stop loss. They make the bigger bucks here on these traders. Many of these traders will either margin themselves out or cry uncle after they're down 75 to 100 pips or more.
And then, just as quick as it began, at some point during the day, the market will stop trending in that direction and begin consolidating and moving back the other way. The market makers at this point are satisfied with the gains they have and they've managed to hook a good many traders. For the traders who are still hanging in there but are deep underwater, the roll fees then start kicking in. You wind up with interest charges that accumulate as soon as the day ends.
So why does the market stop trending and then going back in the other direction to almost always form another consolidation channel? Simple...while there are profit takers at this point, it is in the market makers best interest to begin forming another consolidation channel further back up the line instead of having to start at the very bottom and moving it up or starting at the very top and moving it down and then consolidating. In other words, they don't have to start at zero the next day...they already have it consolidating and it's retail traders John Doe and Suzie Q who make up the small movements that occur through the night. (Unless of course the overseas market makers decide to step in and contribute to some large movements overnight.)
So what we're looking for is the FIRST direction the market makers take when they break either the top or the bottom of a tightly trending Asian channel. That first move is almost always a head fake and is designed to mask the true intentions the market makers have for the day. They want to hide the trend until it's too late for the traders to do anything about it.
So if they move up first, the true trend is usually down for the day. If they move down first, the true trend is usually up for the day. Not always, of course, but this is usually the case.
What we watch for is the pattern to form...namely either the M (bearish) or the W (bullish). Most of us have seen these patterns in the market. They occur all the time in things like Gartleys, butterfly patterns, elliott waves, head and shoulders, etc.
I have a couple of examples below. I have an indicator that automatically marks off the Asian session open and the Asian session close along with the top and bottom trend lines that it automatically draws in. Notice there are absolutely no indicators or moving averages on the chart. The idea is to be able to trade without these at all. Of course, they still have some merit. That's why pairs will often reverse at an MA100 or MA200. But they can blow right through them as well.
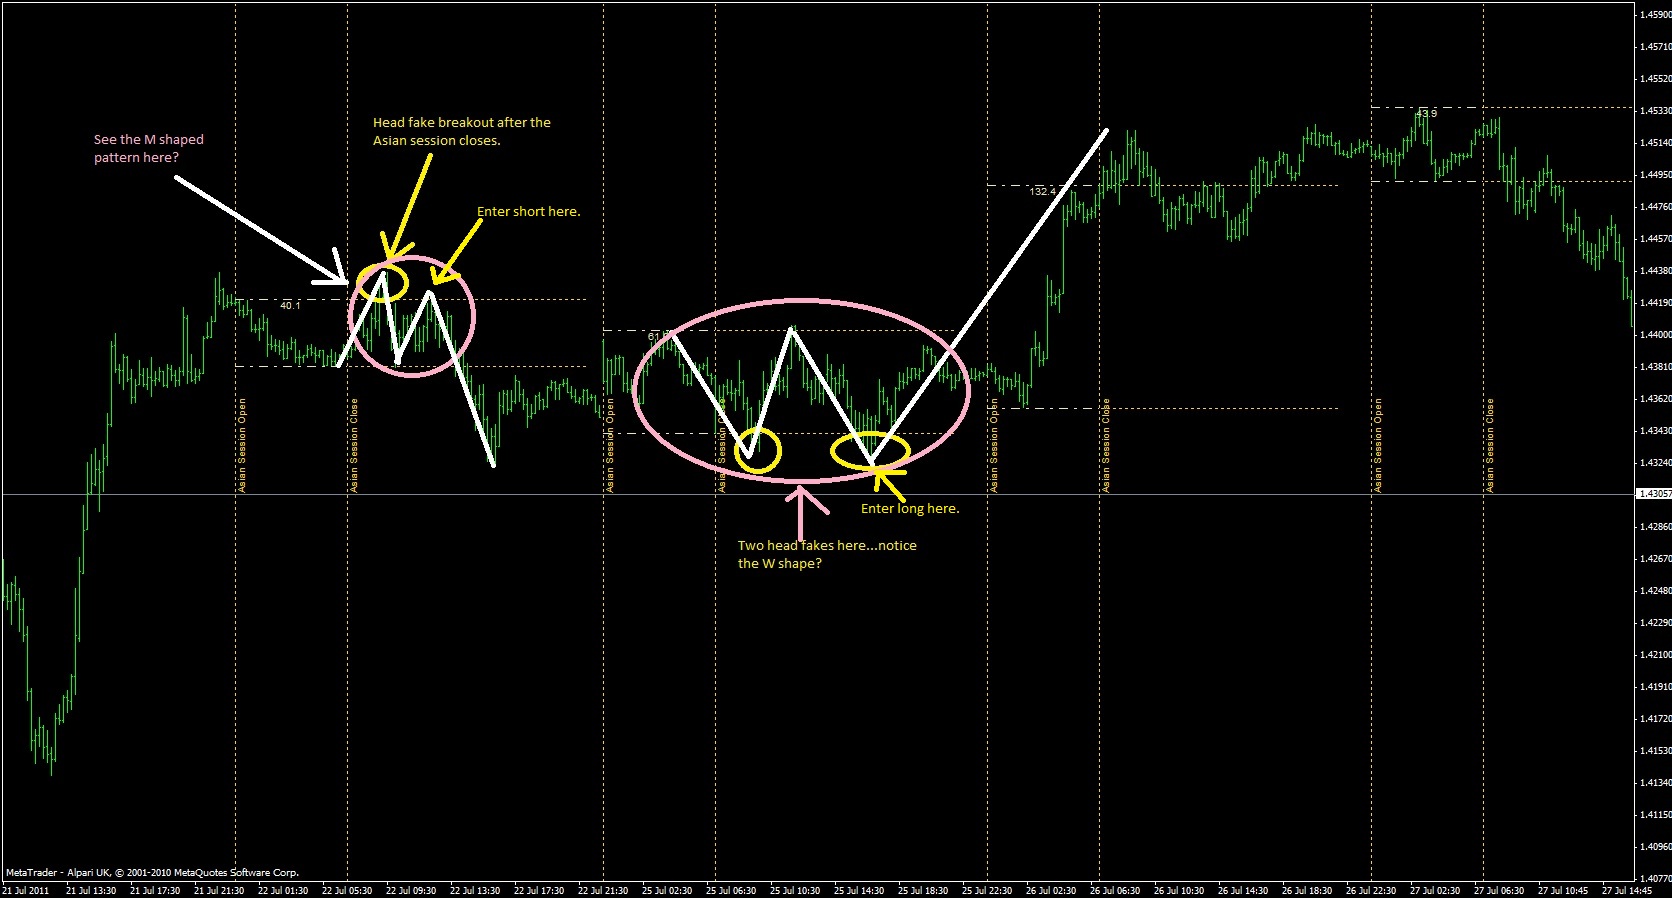
The first example is bearish. You can easily see the first break above the Asian session trend line, then the first big move back down and then a bounce back up. This forms the first 3 legs of the M pattern. We now know this is a bearish pattern because the first move was above the top trend line and we know that's usually a head fake.
Usually, the second move back up on these patterns will not make a new high. As a matter of fact, they almost always move back up to the 78.6 fib of the first move down. In other words, the last leg up is 78.6 percent as long as the first move from the top to the bottom.
Sometimes the M can be symmetrical...this is where the legs are almost equal in length. But the pattern still holds...the M shape is bearish.
The second instance is a W shape. Notice that the first move after the Asian session was a break to the downside that did not last long. This took out any longs who had stop losses there and it also suckered in a bunch of new shorts who though it was going to dive. Then the market moved right back up again and stopped just above the top trend line...triggering a bunch of stops for the shorts.
Then it actually drops back again below the bottom line before setting up for the final move that it always had in mind....up.
The bottom line is this...these setups help to telegraph what the market makers have in mind for the day. Go back through your charts. Use the 15 minute time frame and look for these setups. I guarantee that no matter which pair you choose, you will see this setup over and over again. Watch for the head fake and then see where the true trend takes you. I betcha that more times than not, the true trend is in the opposite direction.

Join the InvestorsHub Community
Register for free to join our community of investors and share your ideas. You will also get access to streaming quotes, interactive charts, trades, portfolio, live options flow and more tools.

