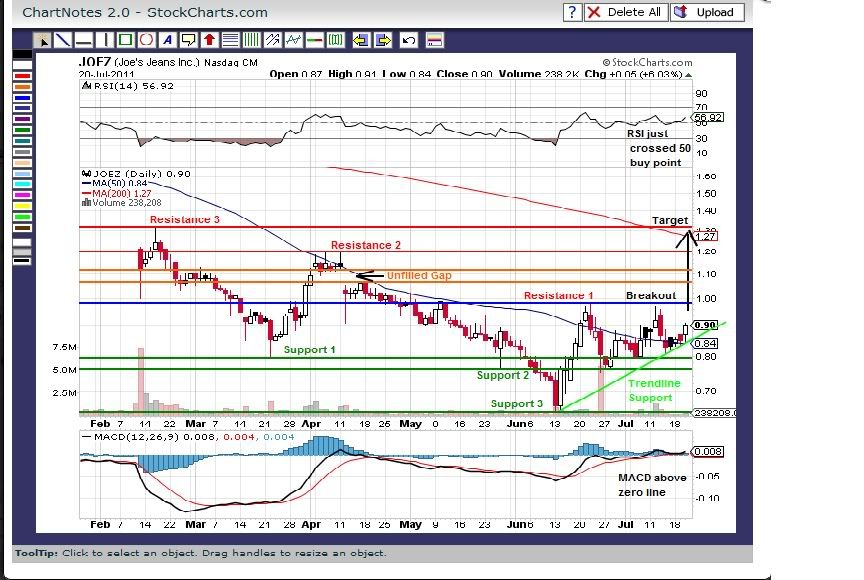
[img]JOEZ - huge breakout forming on the daily chart
JOEZ looks like the daily chart is forming a revival breakout pattern. It had earnings last week that beat analyst estimates, and it once again earned a profit (which is rare for a stock trading under $1.00), after previous losses. The stock was in a long term down trend and put in a bottoming pattern over the past 5 weeks. It tested the breakout point around $.96 two times and failed both times, but on the second sell off the sellers couldn't get the stock to break back to the $.75 lows, and instead it put in a higher low finding support at $.82 (with more support at $.75. The pattern is almost a cup and handle type pattern and the handle is forming right now. The stock was accumulated today by the smart money that are expecting a big breakout at $.96. The stock has an unfilled gap around $1.13, and the resistance at $1.20 and $1.32 so these are my targets. The stock will need to get some volume if its going to breakout, but I think this is shaping up to be a really good trade. I got long today at .90 for 15k shares when I saw the buyers coming in. If the stock breaks $.96 I will add 15k shares. If the stock drops below .81 I will stop out. This swing trade may take a week or more to play out, but it should explode to the upside once traders see this chart. See my annotated chart.
Register for free to join our community of investors and share your ideas. You will also get access to streaming quotes, interactive charts, trades, portfolio, live options flow and more tools.
 News
News  Market Data
  Discover