


| Followers | 70 |
| Posts | 15576 |
| Boards Moderated | 2 |
| Alias Born | 05/14/2010 |
Friday, November 19, 2010 10:49:16 PM

They are basically periods of consolidation and can take on different sizes. When you go to years you get bear "cyclical markets":
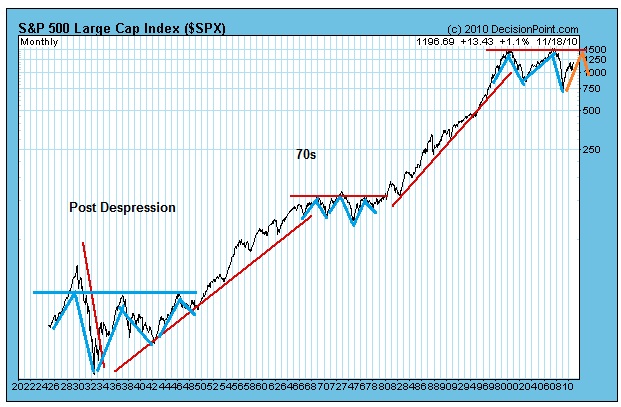
So the Despression period started in 1929 and really didn't end until 1950 for 21 years. The 70s started in 1966 and ended in 1978 for only 12 years. The current era started in 2000 and the argument is weather or not it ended in 1999 for only 9 years. Guess the answer is wheather or not we bust through 1500 on the SP 500 and thus only had two tops rather than the 3 of the past.
Many are saying we will languish for another 10 years. But This will break the wave pattern. Maybe well have 4 tops? What's clear is you have to respect to trend and body of theory as so many are pursuing now in auto pilot... Which tends to suggust no major breakdowns for another year followed by another downturn for 2 years of so. Looking at last two bear cyclical cycles, the last leg down was a mild one. That's not to say this time couldn't be different...
As for the article above, Stock Charts message is we may see some consolidation now and then probably break out higher. a mover higher to 1500 or so gives with the greater pattern, though there could be variation.
As for today, my bet for a little pullback should be short lived, but who knows, maybe it will turn into in a more substantial pullback to the 200 day. Or maybe I won't get any at all. Just don't see a strong follow through, not quite an abandemded baby, but not strong. A further pull back would in turn gives us a sweeter Elliot Wave to play through Christmas!
Recent BGU News
- Bristol Gate Capital Partners Inc. Announces Estimated Annual Reinvested Distributions for Bristol Gate ETFs • PR Newswire (Canada) • 11/24/2023 08:40:00 PM
Avant Technologies Equipping AI-Managed Data Center with High Performance Computing Systems • AVAI • May 10, 2024 8:00 AM
VAYK Discloses Strategic Conversation on Potential Acquisition of $4 Million Home Service Business • VAYK • May 9, 2024 9:00 AM
Bantec's Howco Awarded $4.19 Million Dollar U.S. Department of Defense Contract • BANT • May 8, 2024 10:00 AM
Element79 Gold Corp Successfully Closes Maverick Springs Option Agreement • ELEM • May 8, 2024 9:05 AM
Kona Gold Beverages, Inc. Achieves April Revenues Exceeding $586,000 • KGKG • May 8, 2024 8:30 AM
Epazz plans to spin off Galaxy Batteries Inc. • EPAZ • May 8, 2024 7:05 AM

