


| Followers | 70 |
| Posts | 15576 |
| Boards Moderated | 2 |
| Alias Born | 05/14/2010 |
Sunday, November 07, 2010 10:50:30 PM
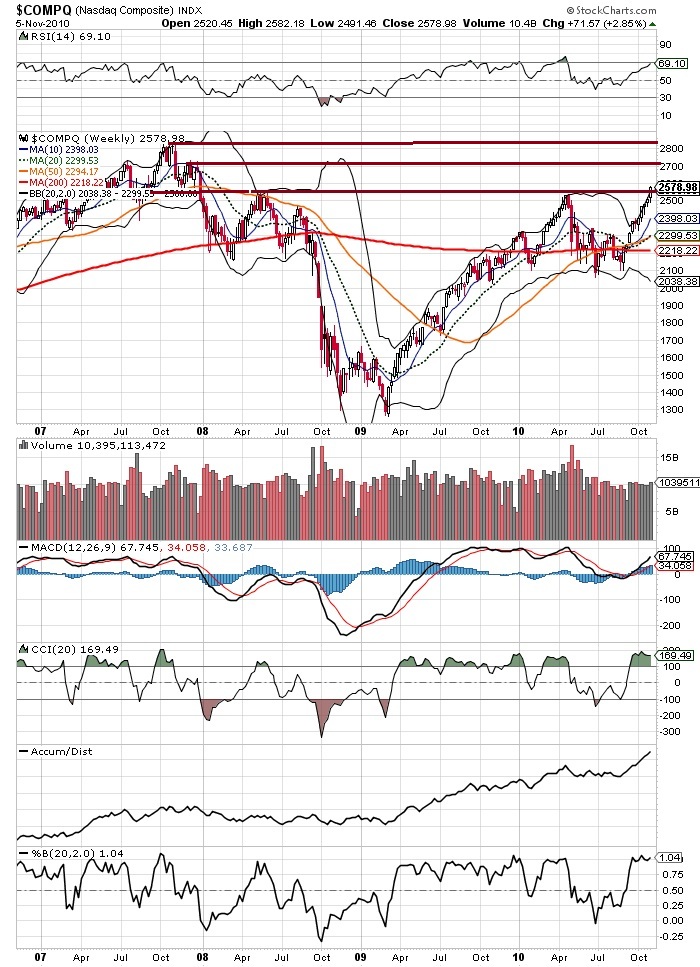
We closed above the last major tops of the past 4 years and it looks 2700 is a possibility.
Looking at the daily chart
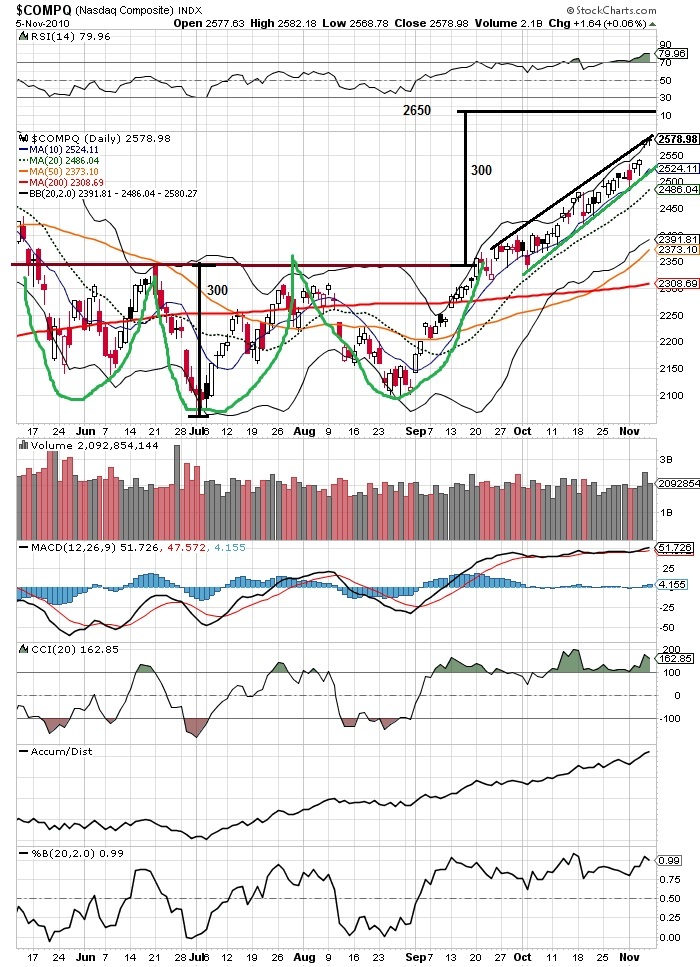
We're at the top of our current channel. All the indicators are off the charts. Maybe we'll see a short term pull back. There was an inverse head and shoulders that John Murphy pointed out as a bullish indicator, which I didn't respect... He says the ultimate move up above the old resistance could be the hieght of the inverse head. This is 300 points and takes us up to 2650.
What all this tells me there is a possible move higher from here. But I also see strong pontential for a pullback of some kind right now based on the current channel. It may take a little longer before the next real leg down...
If I don't see red Monday afternoon may close my current short positions.
FEATURED POET Announces Design Win and Collaboration with Foxconn Interconnect Technology for High-speed AI Systems • May 14, 2024 10:09 AM
FEATURED Element79 Gold Corp Reports Exceptionally High-Grade Results from Lucero • May 14, 2024 7:00 AM
VAYK Added New Manager for Expansion into $64 Billion Domestic Short-term Rental Market • VAYK • May 14, 2024 9:00 AM
Avant Technologies Equipping AI-Managed Data Center with High Performance Computing Systems • AVAI • May 10, 2024 8:00 AM
VAYK Discloses Strategic Conversation on Potential Acquisition of $4 Million Home Service Business • VAYK • May 9, 2024 9:00 AM
Bantec's Howco Awarded $4.19 Million Dollar U.S. Department of Defense Contract • BANT • May 8, 2024 10:00 AM

