


Saturday, August 07, 2010 5:51:32 AM
Charts CANNOT predict drilling results.
Thanks for your response, but I see you are a little confused about the differences between fundamental analysis of a company and technical analysis of the underlying stock. Let me help you out a little...
The first thing to explain is that technical analysis does not set out to predict corporate activity in any way whatsoever, and this is where you have gone wrong. That is the job of fundamental analysis, which I will come to in a moment. Technical analysis looks for patterns in the previous trading history of the company's underlying stock and then uses those patterns to help predict the future by projecting likely continuations or reversals based upon previous performance of stock. A lot of trading and investing works on human judgement - crowd psychology if you like - so when certain patterns occur in a stock's performance it is possible to predict the likely direction that the stock will move in next. Of course these predictions are by no means fool proof, but they do most definitely work. There are two levels of information which good chart technical analysts use. Firstly (and most importantly) they use chart patterns (continuation or reversal, as discussed) and then they use additional confirmatory signals from "technical indicators". Now I don't want to bore you too much Gump90, but let's take a look at this chart of KATX...

First let's look at the chart pattern. What we are interested in is the previous (1.) and current (2.) major trend, plus the most recent minor (3.) trend. Here they are for you...
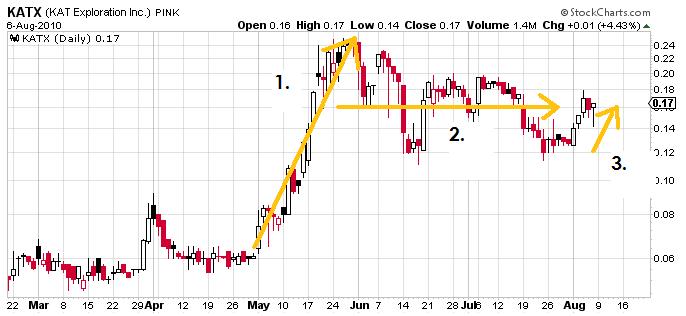
What this tells us is that KATX was trending upwards throughout May, then it stalled in a period of buying/selling indecision which is referred to as oscillation, and the most recent move is a small move upwards. What we watn to find is a pattern that fits these movements. Wedges, flags and pennants are the strongest "continuation patterns" available to us, and fit the scenario perfectly thus...
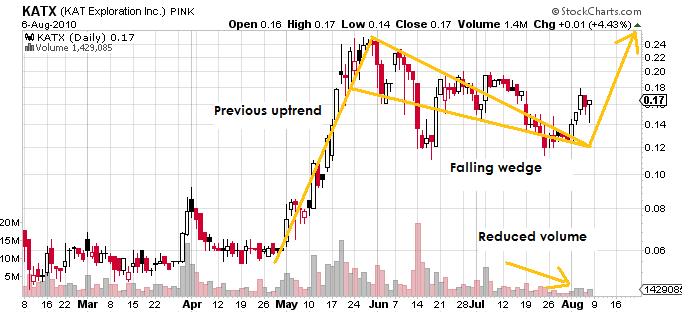
The falling wedge (which is what we see in this instance, and is quite well defined as the lines I have drawn have multiple touches on both sides of the wedge) is made more definite when we compare it with the single most important of all indicators - volume. Note that during the period of indecision volume has got lower and lower. This is a classic signal - a falling wedge combined with reducing volume immediately preceding a strong uptrend. It indicates that the market went into a period of consolidation and is now most likely ready for the next uptrend.
I note that some are using the "double bottom" (also referred to as W shape) pattern on the chart. The double bottom is not a continuation pattern, it is a reversal pattern, so in this case if we saw a "double top" then we would be looking for a chart reversal and for KATX to start to fall. A double bottom is therefore not relevant to the chart in its current situation as the previous trend was already upwards. I hope this makes sense to everyone.
OK now on to the indicators. We have already mentioned volume. Decreasing volume shows more and more indecision. The falling wedge is getting close and closer to its apex, so both the pattern and the most iomportant indicator say "new uptrend very soon". How about other indicators? A couple of common ones are RSI and MACD. RSI (relative strength index) tells us when a stock is overbought or oversold. The RSI is a line which "oscillates" ( ie varies) between 0 and 100. The ideal position for RSI is for the RSI line to be moving upwards and to have just passed the 30% line. Our RSI has moved upwards and just crossed the 50% line, which is still good, and a strong indicator that KATX is oversold and is therefore going to move upwards. This gives us more confirmation to go along with our falling wedge pattern and the low volume. Once the RSI line reaches as high as it will go and starts dropping down again and comes below the 70% line it will be indicating that KATX is oversold. No worries there - we're nowhere near that!
Next up is MACD. MACD is another oscilaating indicator. There are two lines, red and black. When the two lines are at or near the top of their oscillation and the red line crosses over the black line this is a strong selling indication. Conversely when the two lines are at or near the bottom and the black line crosses over and is on top of the red line then this is a strong buying indication. As you can see, we currently have a confirmation from MACD that now is a good buying opportunity. MACD is predicting KATX will go up. You can also view MACD as a histogram (the little blue rectangles Gump). I won't bore you with the details but divergence (trending in opposite direction to the chart itself) is an indicator of a reversal of that trend, so again the MACD histogram says that KATX will move upwards.
We also have Parabolic SAR (stop and reverse). SAR is above the chart when prices are falling and below the shart when prices are rising. Currently it is below the chart, so we can see that SAR is indicating price increases.
Finally, we could use the 50 day moving average as a confirmation of the whole lot. Note that we are currently nudging the 50DMA. If we can break this line of resistance then we have strong confirmation that we have broken out of the current oscillating pattern and have begun trending upwards.

Now so far we have only discussed the technical indicators. Where you got confused was in mixing this up with the fundamental analysis. Shall we have a look at the fundamentals now? I won;t go through it all, but I suggest you review the iBox and stickies to give the basics - excellent corporate structure, fantastic leadership, amazing assets and so much happening right now!
A strong PR on Handcamp will I am quite sure be timed to coincide with the O/S increase, plus of course the MMs know that there is already some built-in factor for the increase because the market knows things are going to happen. In addition to announcing major success with Handcamp (which hopefully will hurl the newly O/Sd KATG in an upward trajectory) I think Ken will want to ensure that there is no exodus from KATX to KATG, and what better way to do that than to announce some fantastic news for KATX at the same time? I would therefore expect a further announcement regarding Lucky, Rusty Ridge and Cabot, with possible mentions of other properties and plans too. I wrote a list yesterday, and I am optimistic that we get items 1. to 5. from the list, and hopeful that we get more, though to be honest good PRs for just the first three will be sufficient!
1.) HC results
2.) RR drilling
3.) KATG O/S change
Like most here I am assuming that these three announcements will pretty much (if not exactly) occur simultaneously.
I think the following could potentially be released as well...
4.) Update on VALE activity at Lucky
5.) Update on activity to date and exploration plans for Cabot
And the following are possible...
6.) Update on exploration plans for Clifton
7.) Update on exploration plans for Shaylee
8.) Update on exploration plans for Colliers
9.) Update on exploration plans for and transfer to KATG of TwiLite
Less likely but you never know, we could even get...
10.) Update on plans for listing on an Asian exchange
11.) Update on plans to R/M KATX into KATC
12.) Additional staff and contractors employed
13.) Additional properties claimed, bought or optioned
14.) Goodness knows what else!
Plus of course we could see our KATG distribution shares appearing in our accounts any time.
All in all Gump90, I think KATX is set to rocket skywards, based on both the fundamentals and the technicals. I hope this has helped explain the difference between the two and also how both can be used in combination to make buying and selling decisions.
Rick


