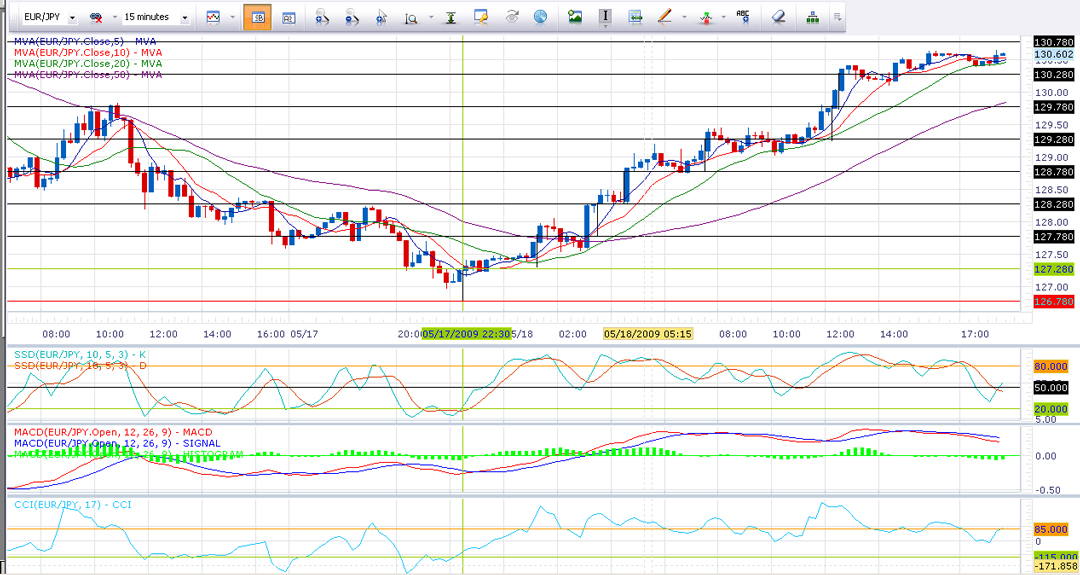
For Sherri and anyone interested. First off I post this here because I don't think I am ready to offer advice on the "GREEN" room. This is a 15 minute chart of EUR/JEN using simple technical indicators. The parameters used for the SSD and CCI where developed using lots of backtesting. To begin with, I don't initially want to enter a trade unless the moving lines on the SSD and CCI are below the green (buy) lines and are crossing back above. This chart here is a back test to show me and other short term traders, that once a trend is formed it is safe to stay in a trade. On the price chart you see the green vertical and horizontal line, my entry point. On my micro account I figured 5 micro lots ($0.50 per pip) with a 50 pip trailing stop would be reasonable and a failure would only cost $25. The orange horizontal is the trailing stop. Each horizontal and short vertical line indicates where the trailing stop would activate. As you can see, the original $25 risk is now worth 250 pips or $125 if the stop gets hit. THe moving lines on the SSD and CCI are staying safely above the but indicator so there is no reason to exit.
Register for free to join our community of investors and share your ideas. You will also get access to streaming quotes, interactive charts, trades, portfolio, live options flow and more tools.
 News
News  Market Data
  Discover