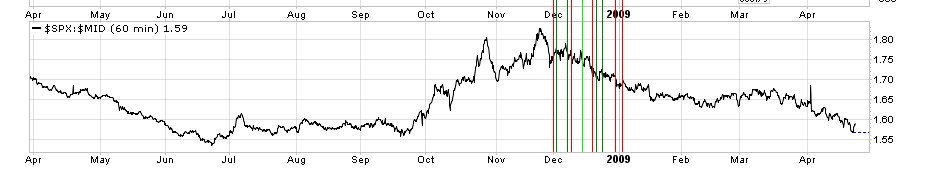
And here I promised myself I'd stay away from the keyboard ... This chart ... <img src=http://images.investorshub.advfn.com/images/uploads/2009/4/23/nmgkqClipboard01.jpg> ratio of spx:mid. If you believe the 'trading range', we're at a low, and so will revert to a mean. Either SPX goes up, or MID goes down. Of course, I've got a short term chart showing the ratio at the top of it's bollinger band too ... Makes markets ...
 News
News  Market Data
  Discover