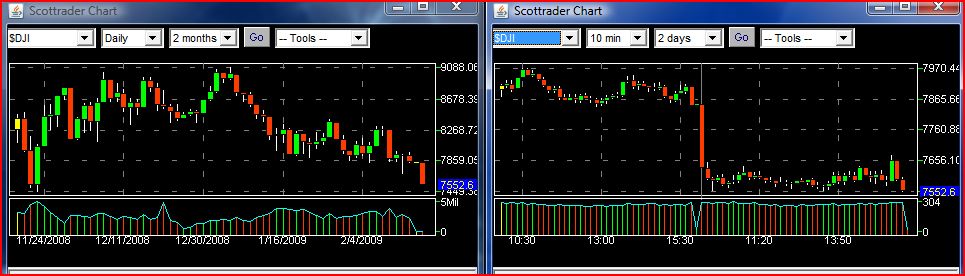
The close on 11/20/08 which is that big red candlestick at the far left of the daily chart below...It closed today at 7552.60 and the close on 11/20 was 7552.29 so "technically" speaking, the Dow closed just barely above a level of support on a closing basis...But, a big red candle like it formed today that closed at the low of the day usually calls for another down day...And the way it ran flat today after a drop at the open of over 200 points is called a 'consolidation in a downtrend', and that is also a Bearish chart pattern...
IF it closes below 7552.29 tomorrow or anytime soon, get your hardhats on because more than the sky will be falling and it's gonna HURT if you're a Bull...
The daily chart's technical indicators are all pointing down...The only good thing is the RSI closed at 34.34 today and when it drops below 30 buyers usually step in, especially as oversold as it is now at zero...So I see a capitulation spike down tomorrow or sometime this week, possibly followed by an oversold rally...
The Dow is now just below the lower Bollinger Band on the weekly chart which is still pointing UP, so it may give it some support here in this area...Especially since the RSI is at a level it has bounced up from two times before in the past...And it's almost into oversold territory on the weekly chart too...So if the RSI drops below 30 and STO drops below 20, we may see an oversold rally...
Register for free to join our community of investors and share your ideas. You will also get access to streaming quotes, interactive charts, trades, portfolio, live options flow and more tools.
 News
News  Market Data
  Discover