ST or SG: For mine, you can remove the "3 hour time frame," as I change that, depending on how much time I can devote to babysitting my trades (quick scalp vs. several-hour trade).
In addition, I thought I'd add what I look for while going long in my setup (the exact opposite will happen when I prepare to go short):
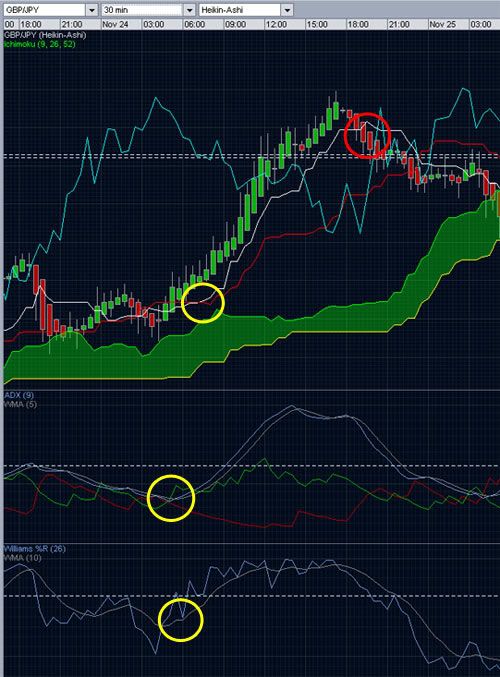
1. MA on the Willie to begin curling upward from beneath the -50 (bottom yellow circle). 2. +DI crosses above -DI, plus the ADX crosses above its MA (middle yellow circle). 3. Tenkan-Sen will rise and cross above Kijun-Sen (white line crosses above red line) (top yellow circle). 4. Once my trade is profitable by 20 pips, or so (fewer pips in shorter timeframes), I'll put my Stop Loss at breakeven. I get stopped out a little more than I'd like, but I have far fewer losing trades. 5. As the trade rises, I'll periodically move my stop loss up so that it's a reasonable distance below the Tenkan-Sen (white line)...sometimes even below the Kijun-Sen (red line) if I'm looking at longer timeframes, or if it's near a resistance level....just to allow for a bit of head-banging against that level. 6. All the while, I check the lines and cloud on other adjacent timeframes to keep an eye out for support and resistance levels. 7. Notice that the Williams bounces off its MA as the price rises (right after the bottom yellow circle). Once it begins to whipsaw above and below the MA, I prepare for an exit and raise my SL even closer to the price (still keeping it below the Tenkan-Sen). 8. Either of these signals will tell me to exit...or move my SL up to the Tenkan-Sen: The -DI crosses back above the +DI and/or the Willie's MA curls downward...notice that both occur around the time that the price falls below the Tenkan-Sen (red circle).
Register for free to join our community of investors and share your ideas. You will also get access to streaming quotes, interactive charts, trades, portfolio, live options flow and more tools.
 News
News  Market Data
  Discover