| Followers | 71 |
| Posts | 12229 |
| Boards Moderated | 1 |
| Alias Born | 04/01/2000 |
Sunday, October 05, 2008 11:15:24 AM
Amateur Investors Weekend Stock Market Analysis (10/4/08)
http://www.amateur-investor.net/Weekend_Market_Analysis_Oct_4_08.htm
The volatility in the market has reached levels not seen since the Fall of 1987 as there have been violent swings in both directions on a daily basis and I don't see this changing in the foreseeable future.
Meanwhile fear among investors has increased substantially the past few weeks as the Volatility Index (VXO) has reached levels that hasn't occurred very often going back to its inception in 1986. This week the VXO rose above the 50 level which has only occurred 11 times prior to this week going back to 1986. In fact the VXO closed at the highest weekly level since 10/23/1987 which coincided with the 1987 market crash.
The table below shows all of the weeks going back to 1986 in which the VXO reached or exceeded the 50 level and what occurred in the following weeks as far as performance in the S&P 500.
Notice when the VXO had a Weekly Close that was Rising accompanied by a Decrease in the Weekly Closing Price (highlighted in Blue) significant oversold rallies developed shortly thereafter ranging +4.4% to as high as +15.8% over a period of 2 to 4 weeks. On the other hand when the Weekly VXO was Falling and the Weekly Closing Price was Increasing (highlighted in Red) the oversold rallies ranged from +0.6% to as high as +13.2% over a period of 2 to 4 weeks.
Thus the average gain when the VXO was Rising and the Weekly Price Falling was +10.5% versus an average gain of +6.9% when the VXO was Falling and the Weekly Price was Rising.
Week Closing Weekly VXO Weekly Opening 4 Week 4 Week % %
Ending VXO Rising/Falling Price Trend Price High Low Gain Loss
10/23/1987 98.81 Rising Down 3 227.66 257.20 235.88 13.0 0.0
12/4/1987 47.63 Rising Down 5 228.75 253.35 223.91 10.7 -2.1
1/8/1988 49.36 Rising Down 2 247.49 258.27 240.16 4.4 -2.9
1/15/1988 36.37 Falling Up 1 251.88 258.86 240.16 2.8 -4.6
10/20/1989 22.95 Falling Up 1 344.83 348.18 330.9 1.0 -4.0
10/31/1997 34.46 Rising Down 3 914.62 964.55 900.61 5.5 -1.5
9/4/1998 44.61 Rising Down 2 974.00 1066.10 968.65 9.5 -0.5
10/9/1998 45.69 Rising Down 2 985.30 1141.30 985.3 15.8 0.0
9/21/2001 48.27 Rising Down 1 965.80 1107.12 965.8 14.6 0.0
7/26/2002 40.44 Falling Up 1 852.84 965.00 833.44 13.2 -2.3
10/11/2002 43.44 Falling Up 1 835.32 925.67 828.48 10.8 -0.8
10/3/2008 51.76 Rising Down 2 ? ? ? ? ?
Here are a few charts of those periods when the Weekly VXO was Rising accompanied by a Falling Weekly Price in the S&P 500.
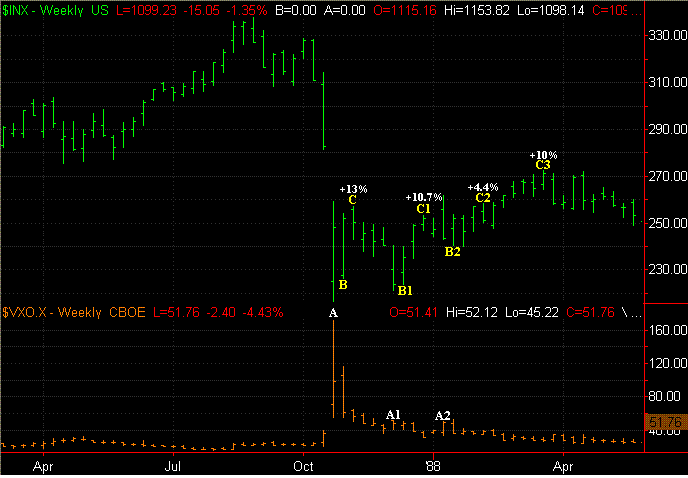
The first chart is from 1987 when the Weekly VXO closed at 98.81 (point A) for the week ending on 10/23/1987. In this example the S&P 500 gained 13% over a 2 week period (points B to C). Then for the week ending on 12/4/1987 the VXO rose back above 50 and closed at 47.63 (point A1). This was followed by a 10.7% gain in the S&P 500 over the next 3 weeks (points B1 to C1). Meanwhile in the January of 1988 the VXO once again rose above the 50 level and closed at 49.36 (A2) for the week ending on 1/8/1988. In this case the S&P 500 only gained 4.4% over a 4 week period (points B2 to C2) however over a 10 week period the S&P 500 ended up with a 10.3% gain (points B2 to C3).
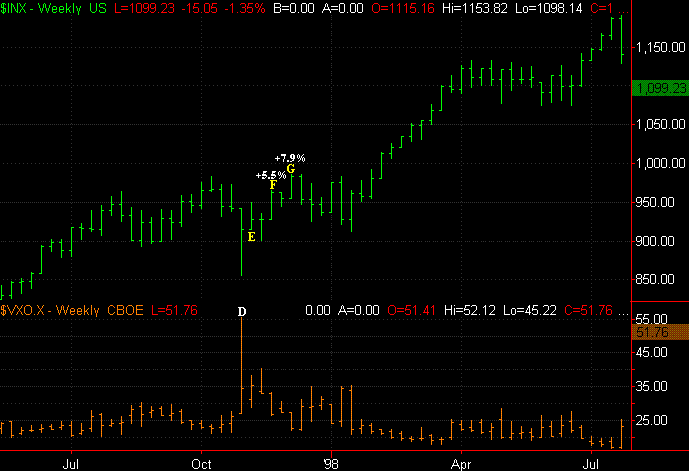
Next is a chart from 1997 when the Weekly VXO rose above the 50 level (point D) and closed at 34.36 during the week of 10/31/1997. In this example the S&P 500 gained 5.5% in 3 weeks (points E to F) and 7.9% over a 5 week period (points E to G).
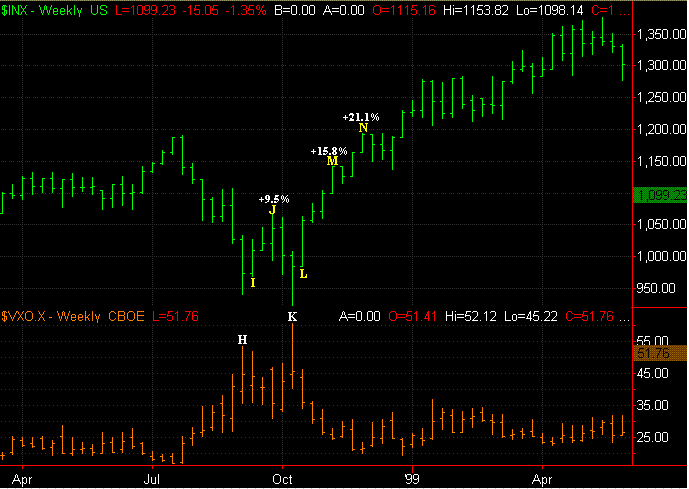
The next chart is from September of 1998 in which the Weekly VXO rose above the 50 level and closed at 44.61 for the week ending on 9/4/1998. In this case the S&P 500 gained 9.5% over a three week period (points I to J). Meanwhile the second case in 1998 in which the VXO rose back above the 50 level (point K) and closed at 45.69 was for the week ending on 10/9/1998. In this example the S&P 500 gained 15.8% over a 4 week period (points L to M) and 21.1% over a 7 week period (points L to N).
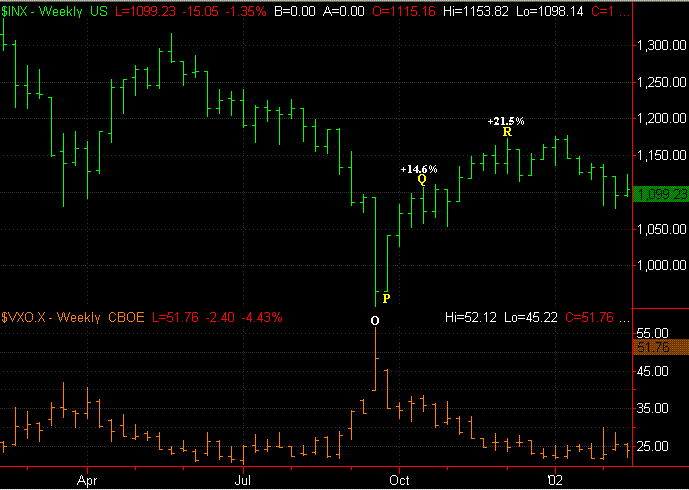
The next case occurred in September of 2001 when the VXO rose above the 50 level (point O) and closed at 48.27 for the week ending on 9/21 which was just after the 9/11. In this case the S&P 500 gained 14.6% over a 4 week period (points P to Q) and 21.5% over an 11 week period (points P to R).
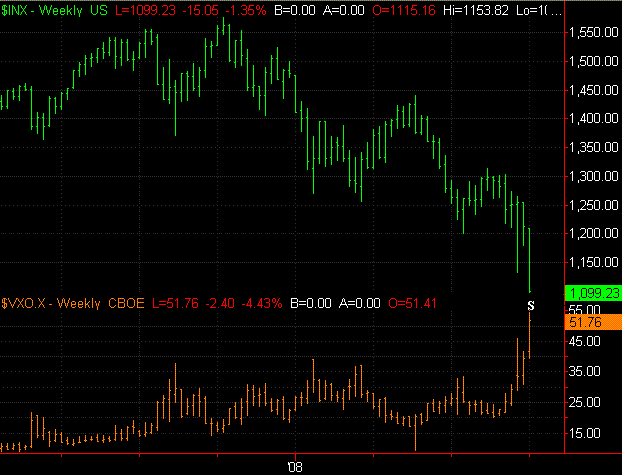
Meanwhile if we take a look at a current chart of the Weekly VXO and the S&P 500 there is a similar pattern developing like has occurred in the past. Notice the Weekly VXO is rising and closed above the 50 level on Friday (point S) as the S&P 500 closed much lower for the 2nd week in a row.
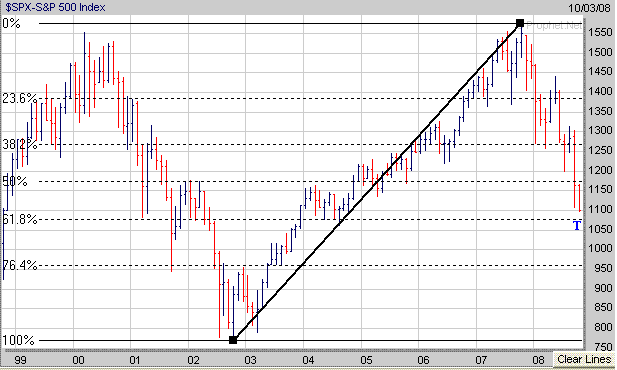
Furthermore if we look at a longer term chart of the S&P 500 and add in the Retracement Levels calculated from the October 2002 low to the October 2007 high notice the 61.8% Retracement Level resides just below the 1080 level (point T) so the S&P 500 is getting very close to this key longer term support level. Thus this could be a level to watch next week for a potential oversold rally to develop from.
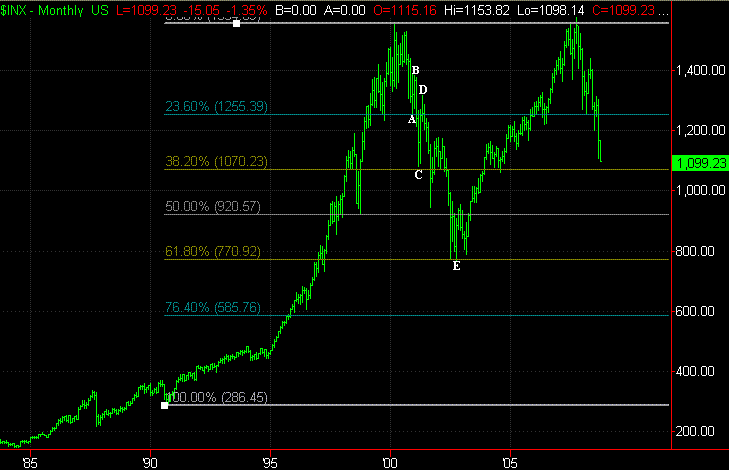
Keep in mind even in the last Bear Market from 2000 through 2002 the S&P 500 bounced off of key longer term Retracement Levels that were calculated from the 1990 low to the 2000 high as shown in the chart below. The first oversold bounce occurred at the 23.6% Retracement level near 1255 (point A) which was followed by a brief one month rally (points A to B). Meanwhile a second oversold bounce occurred near the 38.2% Retracement Level (point C) which was followed by a 2 month rally (points C to D). Then in late 2002 the S&P 500 found support at its 61.8% Retracement Level near 770 (point E) which ended up being a major bottom which was then followed by a Bull Market from October of 2002 through October of 2007.
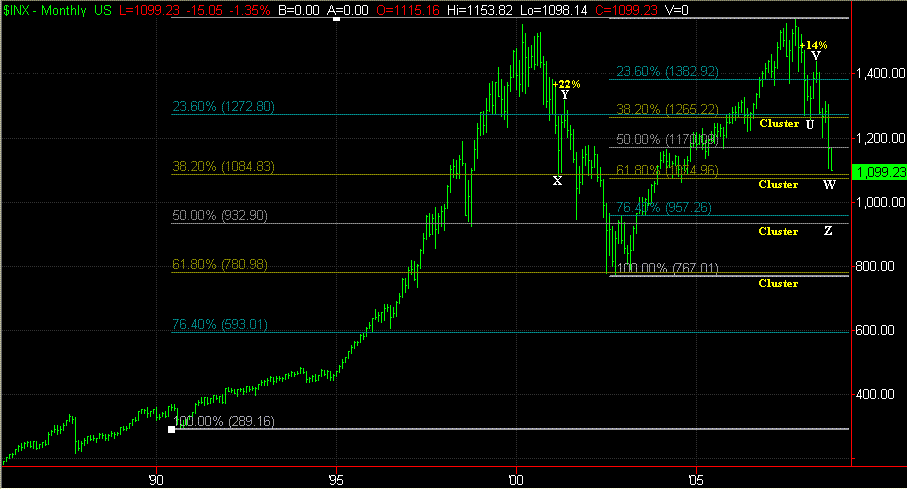
Now if we take the Retracement Levels calculated from the low made in late 1990 to the high in 2007 and combine that with the Retracement Levels calculated from the low in 2002 to the high in 2007 notice that the Retracement Levels Clustered near the 1265 area last Spring (point U) in the S&P 500 which was followed by a sharp oversold bounce lasting from mid March through mid May (points U to V) in which the S&P 500 gained just over 14% in two months. Meanwhile notice the next significant Retracement Level Cluster is in the 1075 to 1084 zone (point W) so this could be an area to watch next week for a potential sharp oversold bounce to develop off of. In addition also notice this area is where the S&P 500 found support at in the Spring of 2001 (point X) as well which was followed by a significant 2 month oversold bounce in which it gained nearly 22% (points X to Y).
Now for the Bearish crowd. If the S&P 500 fails to hold support in the 1075 to 1084 range the next Retracement Level Cluster is in the 933 to 957 range (point Z) so things could get real ugly if the S&P 500 isn't able to hold support at or above the 1075 level in the near term.
Keep in mind the Bear Market is probably far from being done however it appears several things are coming together from a technical perspective to signal that a significant oversold bounce lasting anywhere from 2 to 4 weeks could be approaching but the market may still have to go somewhat lower in the short term before it develops.
So far in 2008 our ETF Strategies have worked the best with our SPY ETF which tracks the S&P 500 and is up 27% versus the S&P 500 which is now down -25% for the year.
http://www.amateur-investor.net/Weekend_Market_Analysis_Oct_4_08.htm
The volatility in the market has reached levels not seen since the Fall of 1987 as there have been violent swings in both directions on a daily basis and I don't see this changing in the foreseeable future.
Meanwhile fear among investors has increased substantially the past few weeks as the Volatility Index (VXO) has reached levels that hasn't occurred very often going back to its inception in 1986. This week the VXO rose above the 50 level which has only occurred 11 times prior to this week going back to 1986. In fact the VXO closed at the highest weekly level since 10/23/1987 which coincided with the 1987 market crash.
The table below shows all of the weeks going back to 1986 in which the VXO reached or exceeded the 50 level and what occurred in the following weeks as far as performance in the S&P 500.
Notice when the VXO had a Weekly Close that was Rising accompanied by a Decrease in the Weekly Closing Price (highlighted in Blue) significant oversold rallies developed shortly thereafter ranging +4.4% to as high as +15.8% over a period of 2 to 4 weeks. On the other hand when the Weekly VXO was Falling and the Weekly Closing Price was Increasing (highlighted in Red) the oversold rallies ranged from +0.6% to as high as +13.2% over a period of 2 to 4 weeks.
Thus the average gain when the VXO was Rising and the Weekly Price Falling was +10.5% versus an average gain of +6.9% when the VXO was Falling and the Weekly Price was Rising.
Week Closing Weekly VXO Weekly Opening 4 Week 4 Week % %
Ending VXO Rising/Falling Price Trend Price High Low Gain Loss
10/23/1987 98.81 Rising Down 3 227.66 257.20 235.88 13.0 0.0
12/4/1987 47.63 Rising Down 5 228.75 253.35 223.91 10.7 -2.1
1/8/1988 49.36 Rising Down 2 247.49 258.27 240.16 4.4 -2.9
1/15/1988 36.37 Falling Up 1 251.88 258.86 240.16 2.8 -4.6
10/20/1989 22.95 Falling Up 1 344.83 348.18 330.9 1.0 -4.0
10/31/1997 34.46 Rising Down 3 914.62 964.55 900.61 5.5 -1.5
9/4/1998 44.61 Rising Down 2 974.00 1066.10 968.65 9.5 -0.5
10/9/1998 45.69 Rising Down 2 985.30 1141.30 985.3 15.8 0.0
9/21/2001 48.27 Rising Down 1 965.80 1107.12 965.8 14.6 0.0
7/26/2002 40.44 Falling Up 1 852.84 965.00 833.44 13.2 -2.3
10/11/2002 43.44 Falling Up 1 835.32 925.67 828.48 10.8 -0.8
10/3/2008 51.76 Rising Down 2 ? ? ? ? ?
Here are a few charts of those periods when the Weekly VXO was Rising accompanied by a Falling Weekly Price in the S&P 500.
The first chart is from 1987 when the Weekly VXO closed at 98.81 (point A) for the week ending on 10/23/1987. In this example the S&P 500 gained 13% over a 2 week period (points B to C). Then for the week ending on 12/4/1987 the VXO rose back above 50 and closed at 47.63 (point A1). This was followed by a 10.7% gain in the S&P 500 over the next 3 weeks (points B1 to C1). Meanwhile in the January of 1988 the VXO once again rose above the 50 level and closed at 49.36 (A2) for the week ending on 1/8/1988. In this case the S&P 500 only gained 4.4% over a 4 week period (points B2 to C2) however over a 10 week period the S&P 500 ended up with a 10.3% gain (points B2 to C3).

Next is a chart from 1997 when the Weekly VXO rose above the 50 level (point D) and closed at 34.36 during the week of 10/31/1997. In this example the S&P 500 gained 5.5% in 3 weeks (points E to F) and 7.9% over a 5 week period (points E to G).

The next chart is from September of 1998 in which the Weekly VXO rose above the 50 level and closed at 44.61 for the week ending on 9/4/1998. In this case the S&P 500 gained 9.5% over a three week period (points I to J). Meanwhile the second case in 1998 in which the VXO rose back above the 50 level (point K) and closed at 45.69 was for the week ending on 10/9/1998. In this example the S&P 500 gained 15.8% over a 4 week period (points L to M) and 21.1% over a 7 week period (points L to N).

The next case occurred in September of 2001 when the VXO rose above the 50 level (point O) and closed at 48.27 for the week ending on 9/21 which was just after the 9/11. In this case the S&P 500 gained 14.6% over a 4 week period (points P to Q) and 21.5% over an 11 week period (points P to R).

Meanwhile if we take a look at a current chart of the Weekly VXO and the S&P 500 there is a similar pattern developing like has occurred in the past. Notice the Weekly VXO is rising and closed above the 50 level on Friday (point S) as the S&P 500 closed much lower for the 2nd week in a row.

Furthermore if we look at a longer term chart of the S&P 500 and add in the Retracement Levels calculated from the October 2002 low to the October 2007 high notice the 61.8% Retracement Level resides just below the 1080 level (point T) so the S&P 500 is getting very close to this key longer term support level. Thus this could be a level to watch next week for a potential oversold rally to develop from.

Keep in mind even in the last Bear Market from 2000 through 2002 the S&P 500 bounced off of key longer term Retracement Levels that were calculated from the 1990 low to the 2000 high as shown in the chart below. The first oversold bounce occurred at the 23.6% Retracement level near 1255 (point A) which was followed by a brief one month rally (points A to B). Meanwhile a second oversold bounce occurred near the 38.2% Retracement Level (point C) which was followed by a 2 month rally (points C to D). Then in late 2002 the S&P 500 found support at its 61.8% Retracement Level near 770 (point E) which ended up being a major bottom which was then followed by a Bull Market from October of 2002 through October of 2007.

Now if we take the Retracement Levels calculated from the low made in late 1990 to the high in 2007 and combine that with the Retracement Levels calculated from the low in 2002 to the high in 2007 notice that the Retracement Levels Clustered near the 1265 area last Spring (point U) in the S&P 500 which was followed by a sharp oversold bounce lasting from mid March through mid May (points U to V) in which the S&P 500 gained just over 14% in two months. Meanwhile notice the next significant Retracement Level Cluster is in the 1075 to 1084 zone (point W) so this could be an area to watch next week for a potential sharp oversold bounce to develop off of. In addition also notice this area is where the S&P 500 found support at in the Spring of 2001 (point X) as well which was followed by a significant 2 month oversold bounce in which it gained nearly 22% (points X to Y).
Now for the Bearish crowd. If the S&P 500 fails to hold support in the 1075 to 1084 range the next Retracement Level Cluster is in the 933 to 957 range (point Z) so things could get real ugly if the S&P 500 isn't able to hold support at or above the 1075 level in the near term.

Keep in mind the Bear Market is probably far from being done however it appears several things are coming together from a technical perspective to signal that a significant oversold bounce lasting anywhere from 2 to 4 weeks could be approaching but the market may still have to go somewhat lower in the short term before it develops.
So far in 2008 our ETF Strategies have worked the best with our SPY ETF which tracks the S&P 500 and is up 27% versus the S&P 500 which is now down -25% for the year.
Join the InvestorsHub Community
Register for free to join our community of investors and share your ideas. You will also get access to streaming quotes, interactive charts, trades, portfolio, live options flow and more tools.


