


| Followers | 59 |
| Posts | 5508 |
| Boards Moderated | 0 |
| Alias Born | 11/21/2006 |
Monday, February 25, 2008 6:07:40 PM
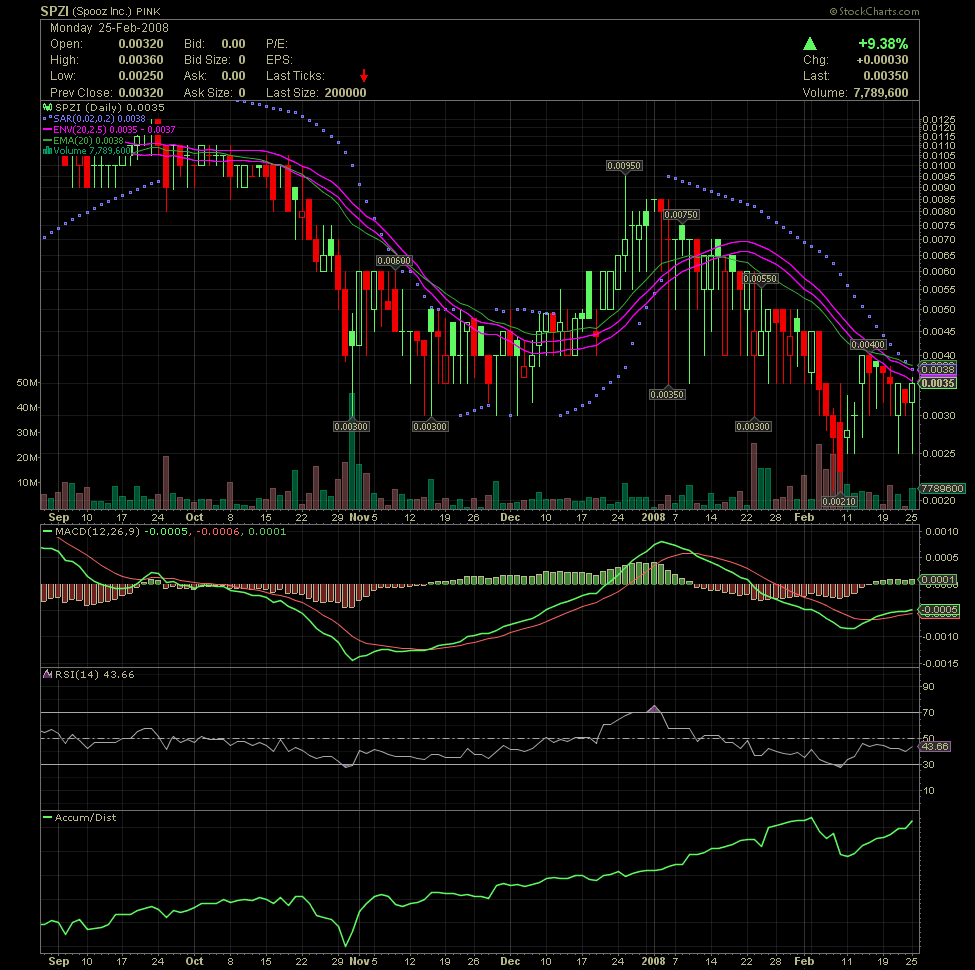
"SAR" stands for 'stop and reverse' and the term 'parabolic' comes from the shape of the curve (resembling a parabola) created on the technical chart.
We want to see the dots go back to the bottom and start ticking up.
Edit: you can read much more if you check out this link. http://www.investopedia.com/articles/technical/02/042202.asp
Hope that helps.
MC
SPOOZCAT RULES BLOOMBERG!!!!!

Try not to obfuscate. All posts are opinion.
Recent SPZI News
- Real Estate Purchase Sending Shares Higher in Heavy Trade • AllPennyStocks.com • 07/18/2024 04:34:00 PM
North Bay Resources Announces Mt. Vernon Gold Mine Startup, Sierra County, California • NBRI • Aug 5, 2024 9:00 AM
Fifty 1 Labs, Inc. and All-In-Extracts Announce Joint Venture to Develop and Release New Testosterone Boosting Supplement • BLEG • Aug 5, 2024 8:30 AM
Kona Gold Beverages, Inc. Announces Strategic Initiatives and Corporate Direction Changes • KGKG • Aug 2, 2024 2:00 PM
POET and Luxshare Tech Expand Product Offerings for Artificial Intelligence Networks • POET • Aug 1, 2024 9:28 AM
Management Discusses Financial Filings of Global Arena Holding Inc., for 10-K 2023 and 10-Q, 1st Quarter 2024 • GAHC • Aug 1, 2024 9:14 AM
VAYK Announces LOI to Acquire $1 Million Home Service Company to Support Airbnb Business • VAYK • Aug 1, 2024 9:00 AM

