Along with support and resistance levels, trendlines are one of the most basic, yet important aspect of technical analysis.
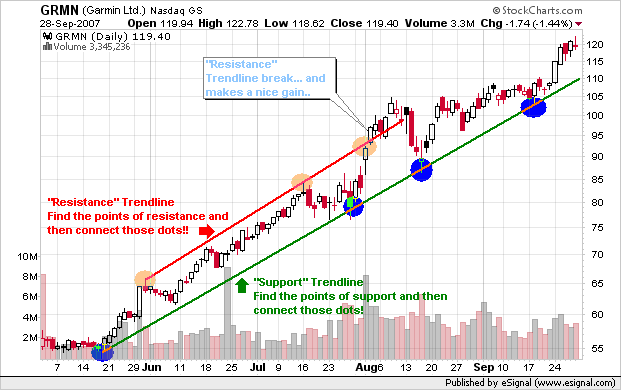
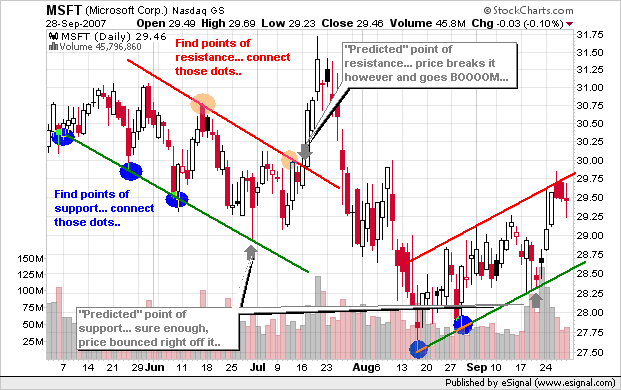
Trendlines main uses are predicting future support/resistance areas, or alerting us as to "when" a breakout (or breakdown) has occurred... meaning, if the trendline is telling us a resistance level should be at point X, but when the price reaches point X, it goes right through, that would be known as a "breakout".
Trendlines are very easy to draw, but you must first understand support/resistances. The easiest way to think about drawing them is a "connect-the-dot" puzzle. Your dots are going to be the points of support/resistance, and when you connect the dots, BOOOOOM, you got yourself a trendline :)
Register for free to join our community of investors and share your ideas. You will also get access to streaming quotes, interactive charts, trades, portfolio, live options flow and more tools.


 News
News  Market Data
  Discover