on mapping the 2005 Statement of Operations onto my spreadsheet? The statement simply lists:
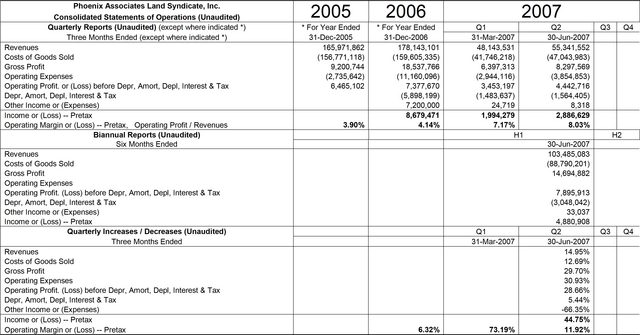
Revenue..................................165,971,862 Costs and Expenses Operation Costs.....................156,771,118 General and Administrative.......2,735,642 Total Costs and Expenses......159,506,760
I think the EBITDA figure of $6,465,102 should go where I put it, but any suggestions are welcome. I’ve used the Operating Profit or (Loss) and Revenues to create an Operating Margin figure which shows a nice steady increase. I know the 2005 and 2006 figures are for an entire year, but if I divided the numerator and denominator, used to create the Operating Margin figure, both by 4; I’d end up with the same ratio and Operating Margin figure for each of four quarters in both years. Probably not completely accurate, but it’s a valid estimation.
The bottom third of the spreadsheet shows a percentage change of each parameter from Q1 to Q2 of 2007. Please note:
Revenues went up...................14.95%, while Cost of goods went up only...12.69%, causing Gross Profit to go up..............29.70%.
Phoenix is producing more at a lower cost. I expect margins will continue to increase.
Register for free to join our community of investors and share your ideas. You will also get access to streaming quotes, interactive charts, trades, portfolio, live options flow and more tools.


 News
News  Market Data
  Discover