


| Followers | 689 |
| Posts | 143817 |
| Boards Moderated | 35 |
| Alias Born | 03/10/2004 |
Tuesday, April 23, 2024 4:25:05 PM
By: Bruce Powers | April 23, 2024
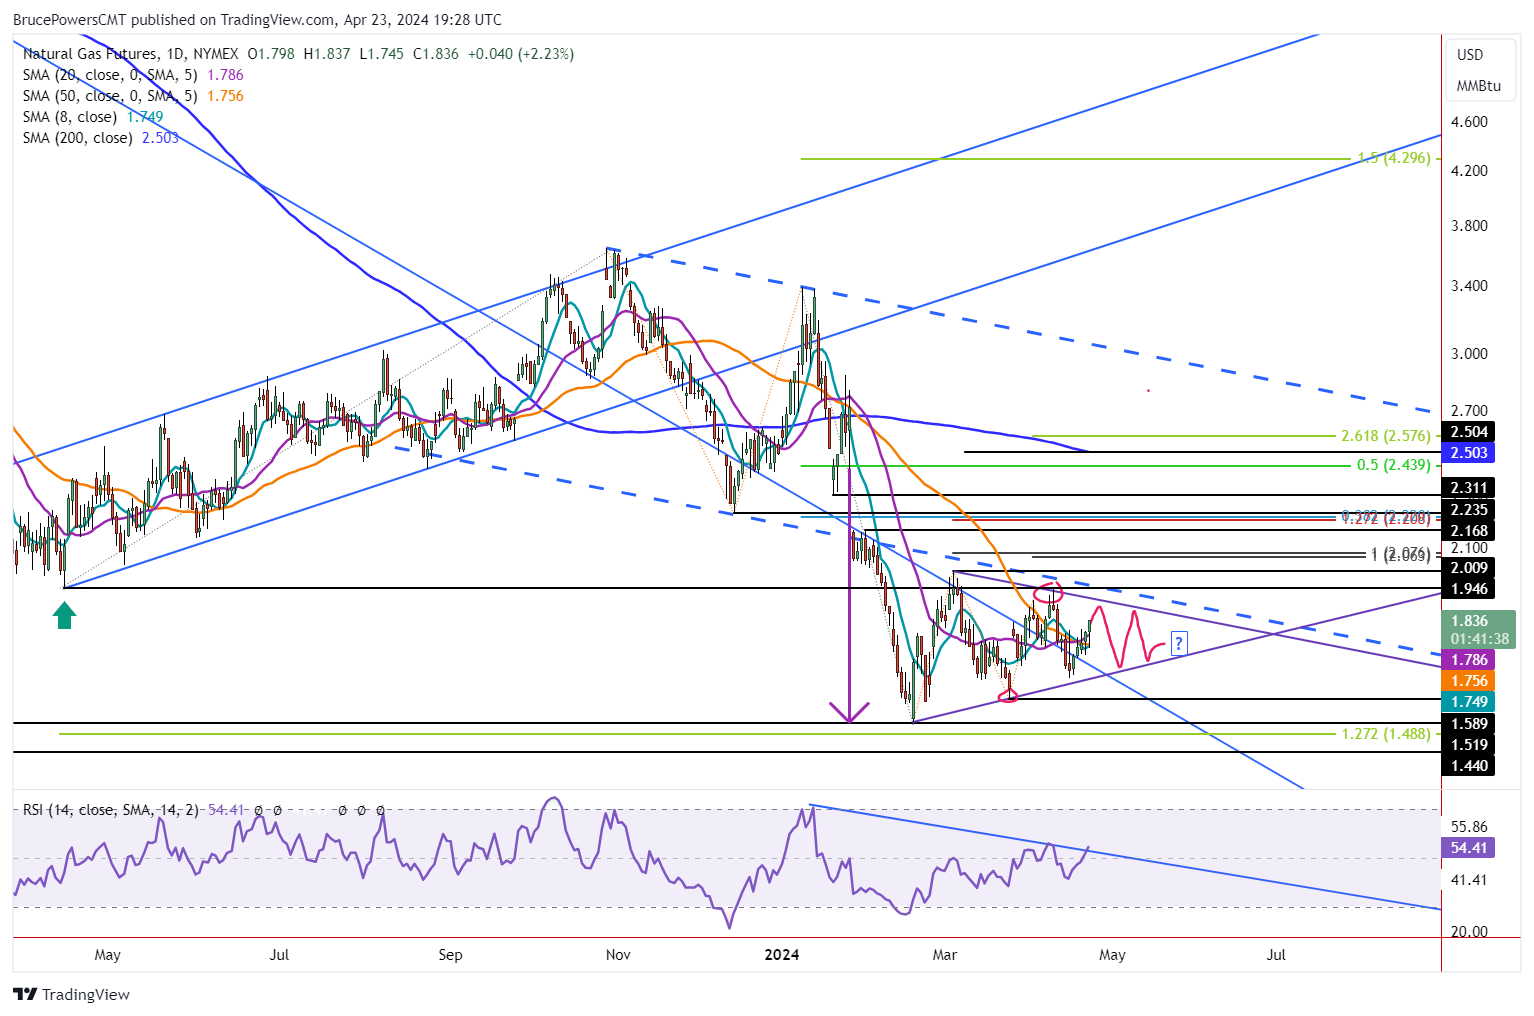
• Natural gas remains stuck in a symmetrical triangle consolidation pattern, starting to break out above last week's high.
Natural gas has begun to break out above last week’s high of 1.806 as it again tests that price area as resistance with Tuesday’s high of 1.808. At the time of this writing, it is on track to end the session with a bullish continuation hammer candlestick pattern. Moreover, notice that the blue 8-Day MA was successfully tested today as support with the day’s low of 1.745. It is the first time in nine days that the 8-Day line has represented support, and it shows improving demand for natural gas, although still a minor change.
Watch for Weekly Breakout
A decisive rally above today’s high will trigger a bullish continuation of the advance that began from the most recent swing low at 1.64. That low tested support around the bottom of a symmetrical triangle consolidation pattern. Once support is seen at the bottom of a triangle and it turns up, a continuation towards the top boundary line of the pattern to test resistance is most likely. Also, since the triangle is well formed, with four points creating the boundaries of the pattern, a breakout can happen from the current advance.
Next Target is Top of Triangle
Resistance may not halt the advance at the top boundary line and instead a breakout could occur. However, keep in mind that upward momentum is essentially beginning from the recent swing low. So, even if the top line is broken there may not be enough demand on the sidelines to keep prices rising in the short term. An alternative bullish scenario would be to see signs of resistance around the top line on the initial approach. And that resistance leads to either consolidation or a pullback as natural gas sets up for a new entry that leads to a decisive upside breakout.
The short-term bearish scenario would see resistance around the top boundary line, leading to a retracement that takes natural gas back down to test support around the lower boundary line. That scenario increases the chance for a bearish breakdown from the triangle pattern.
Weekly Pattern is Bullish
As discussed in Monday’s article on natural gas, the weekly chart pattern shows a breakdown of a bearish shooting star candle last week, followed by a bullish breakout of a hammer candlestick this week. In other words, the market on a weekly basis gave a clear bearish signal, and then flipped around the gave a clear bullish signal. This type of flip from bear to bull in a short period of time is what can lead to sharp moves. In this case up. Certainly, there are no signs of it yet, however.
Read Full Story »»»
 DiscoverGold
Information posted to this board is not meant to suggest any specific action, but to point out the technical signs that can help our readers make their own specific decisions. Caveat emptor!
• DiscoverGold
North Bay Resources Announces Mt. Vernon Gold Mine Bulk Sample, Sierra County, California • NBRI • Sep 11, 2024 9:15 AM
One World Products Issues Shareholder Update Letter • OWPC • Sep 11, 2024 7:27 AM
Kona Gold Beverage Inc. Reports $1.225 Million in Revenue and $133,000 Net Profit for the Quarter • KGKG • Sep 10, 2024 1:30 PM
Element79 Gold Corp Announces 2024 Clover Work Plans & Nevada Portfolio Updates • ELMGF • Sep 10, 2024 11:00 AM
Nightfood Holdings Inc. Completes Major Step on Uplist Journey by Closing Strategic All-Stock Acquisition of CarryoutSupplies.com • NGTF • Sep 10, 2024 8:15 AM
Element79 Gold Corp. Announces Sale of 100% Interest in Elder Creek, North Mill Creek, and Elephant Projects to 1472886 B.C. Ltd. • ELEM • Sep 9, 2024 9:34 AM

