


| Followers | 118 |
| Posts | 10269 |
| Boards Moderated | 1 |
| Alias Born | 11/27/2015 |
Tuesday, April 16, 2024 11:58:23 PM
Using the IBM definition of Linear Regression for those who are NOT familiar with it:
Linear regression analysis is used to predict the value of a variable based on the value of another variable. The variable you want to predict
is called the dependent variable.The variable you are using to predict the other variable's value is called the independent variable.
Taken from
https://www.ibm.com/topics/linear-regression
So X is what I called the coefficient and is the independent variable since it is incremented by 1 each quarter
Y is the dependent variable and represents the Revenue which is analyze by the formulas generated
in the from Y = MX + B
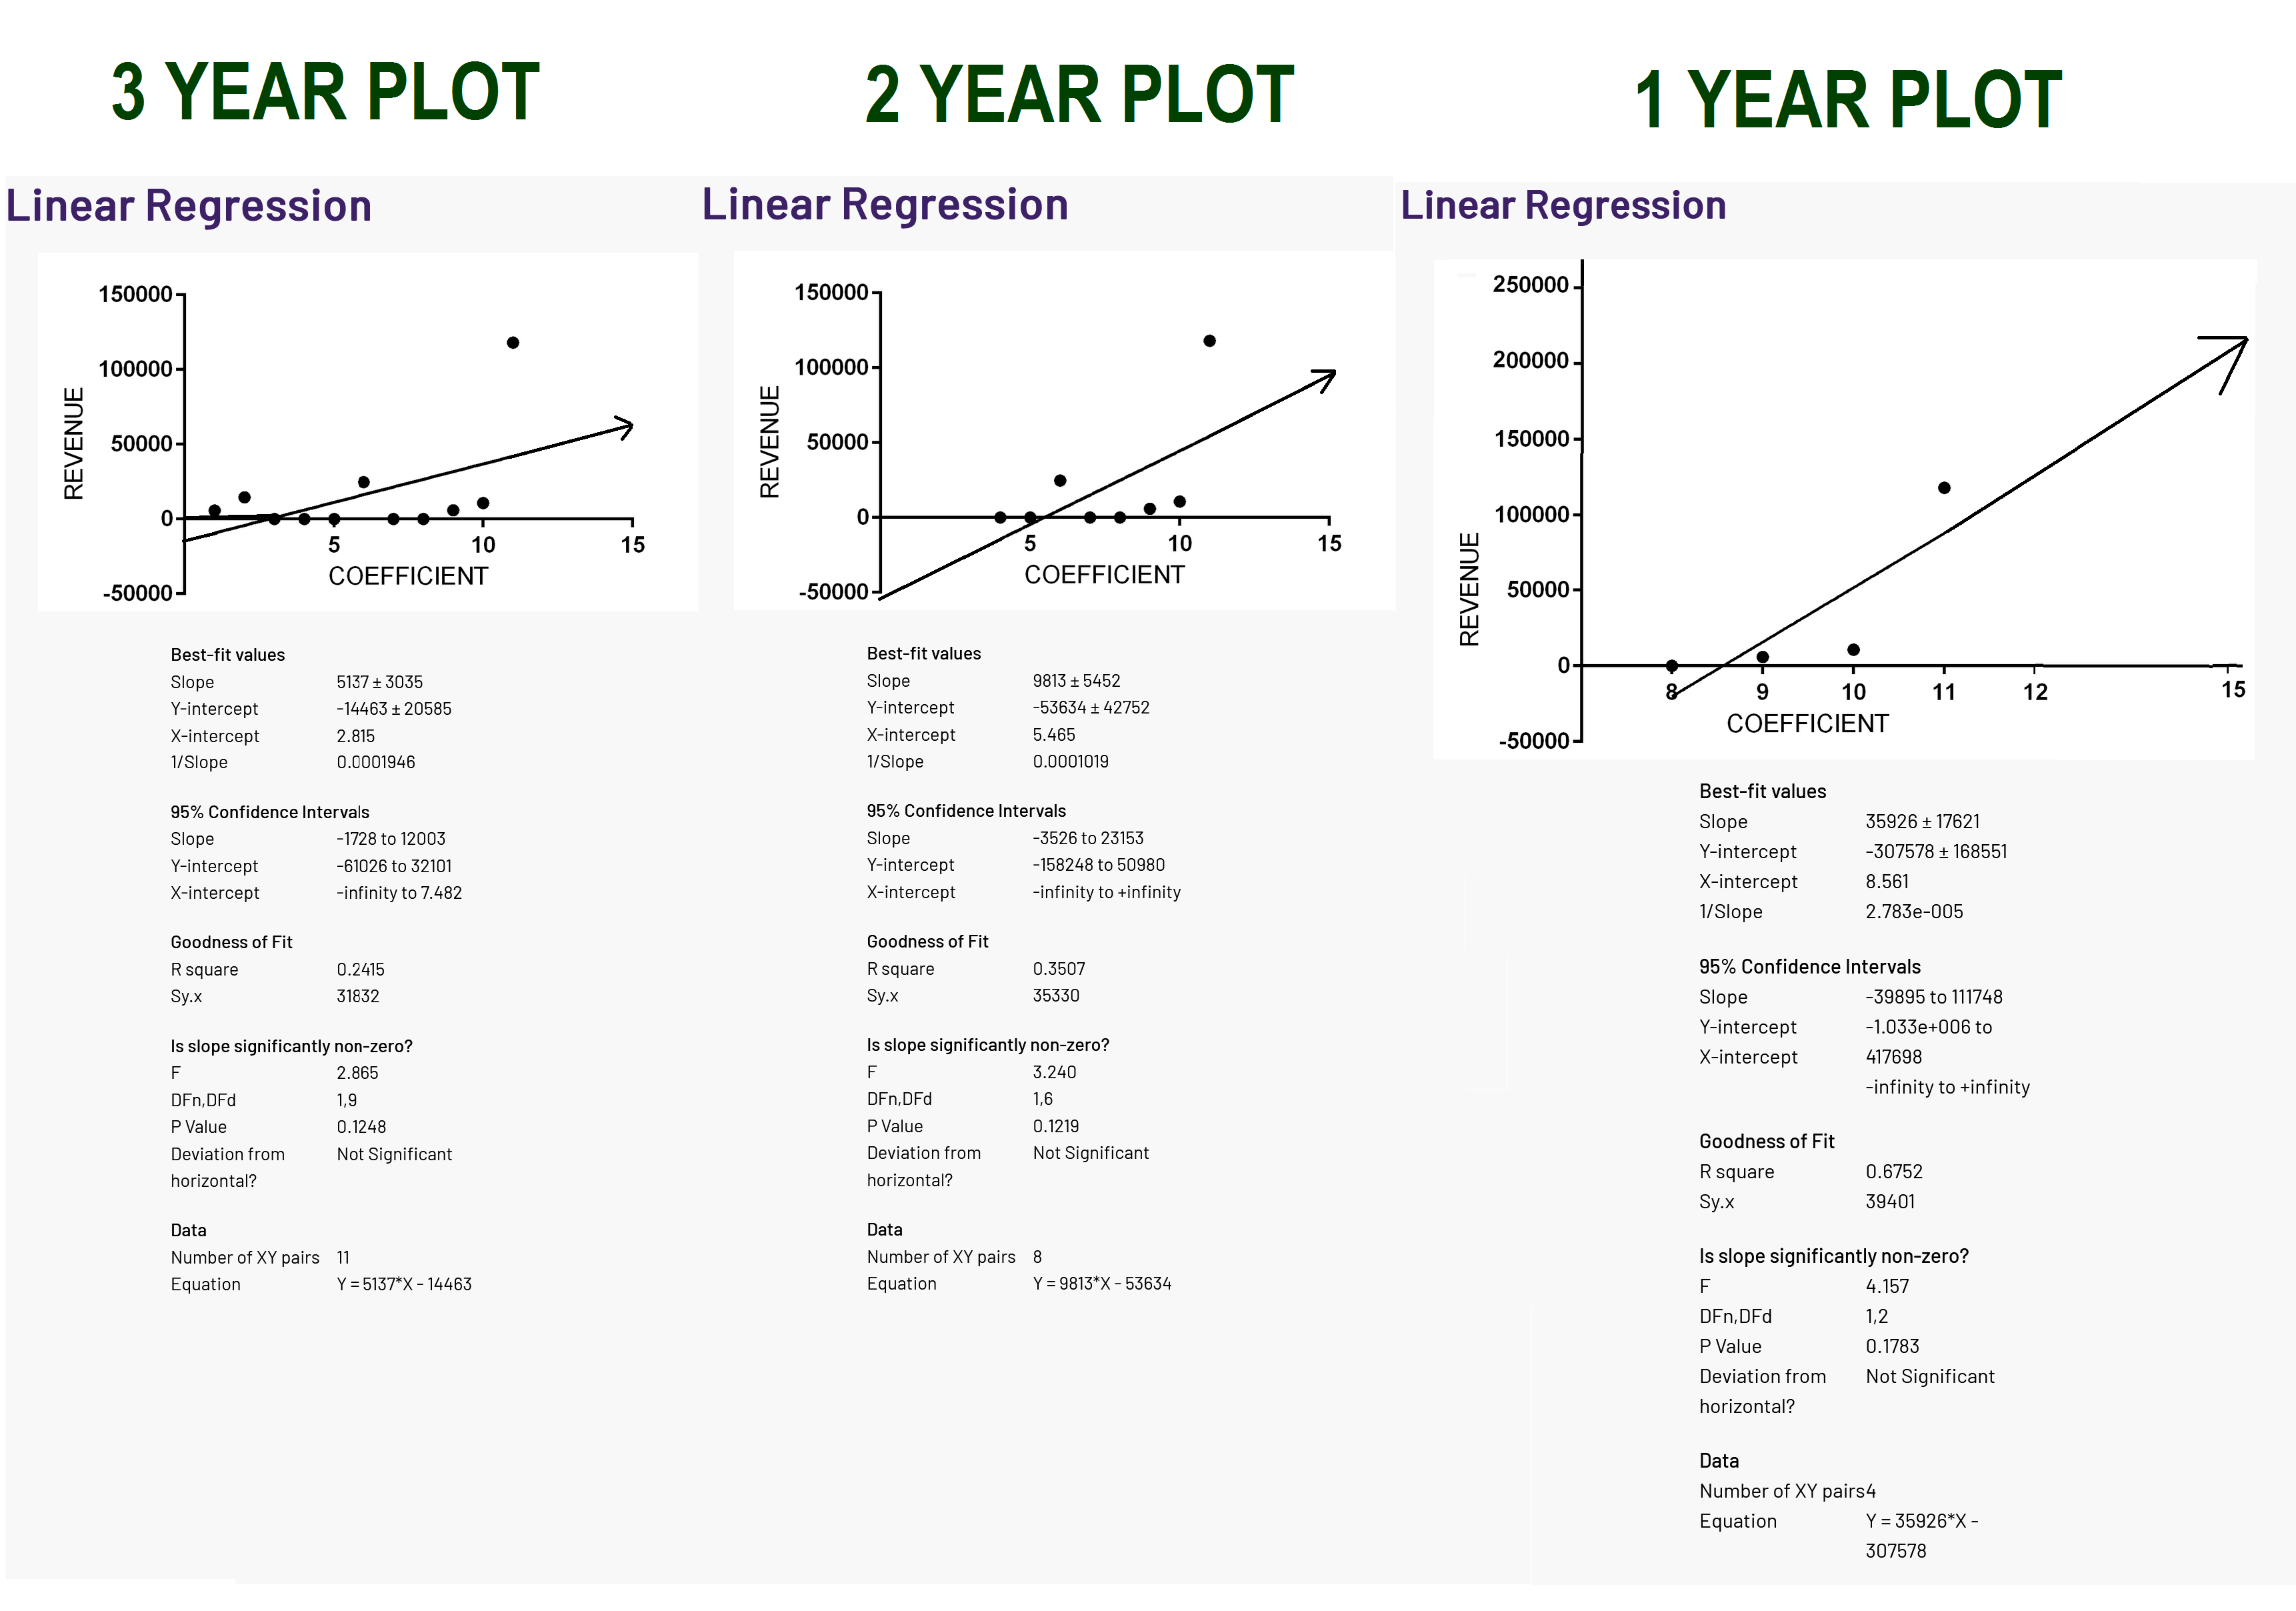
UTILIZING THE Y = MX + B DERIVED FROM THE 11 COEFFICIENTS to Estimate the 1st Quarter Revenue
Using Y=MX + B For the 3 Years, if SRMX performs like the last 3 years
Revenue = 5137*Coefficient - 14463
Revenue = 5137*12 - 14463 = $47,181
Using Y=MX + B For the 2 Years, if SRMX performs like the last 2 years
Revenue = 9813*Coefficient - 53634
Revenue = 9813*12 - 53634 = $64,122
Using Y=MX + B For the 1 year, if SRMX performs like the last year
Revenue = 35926*Coefficient - 307578
Revenue = 35926*12 - 307578 = $123,534
GO SRMX(TCCI)$
NanoViricides Reports that the Phase I NV-387 Clinical Trial is Completed Successfully and Data Lock is Expected Soon • NNVC • May 2, 2024 10:07 AM
ILUS Files Form 10-K and Provides Shareholder Update • ILUS • May 2, 2024 8:52 AM
Avant Technologies Names New CEO Following Acquisition of Healthcare Technology and Data Integration Firm • AVAI • May 2, 2024 8:00 AM
Bantec Engaged in a Letter of Intent to Acquire a Small New Jersey Based Manufacturing Company • BANT • May 1, 2024 10:00 AM
Cannabix Technologies to Deliver Breath Logix Alcohol Screening Device to Australia • BLO • Apr 30, 2024 8:53 AM
Hydromer, Inc. Reports Preliminary Unaudited Financial Results for First Quarter 2024 • HYDI • Apr 29, 2024 9:10 AM

