


| Followers | 679 |
| Posts | 141062 |
| Boards Moderated | 36 |
| Alias Born | 03/10/2004 |
Thursday, April 11, 2024 5:08:13 PM
By: Bruce Powers | April 11, 2024
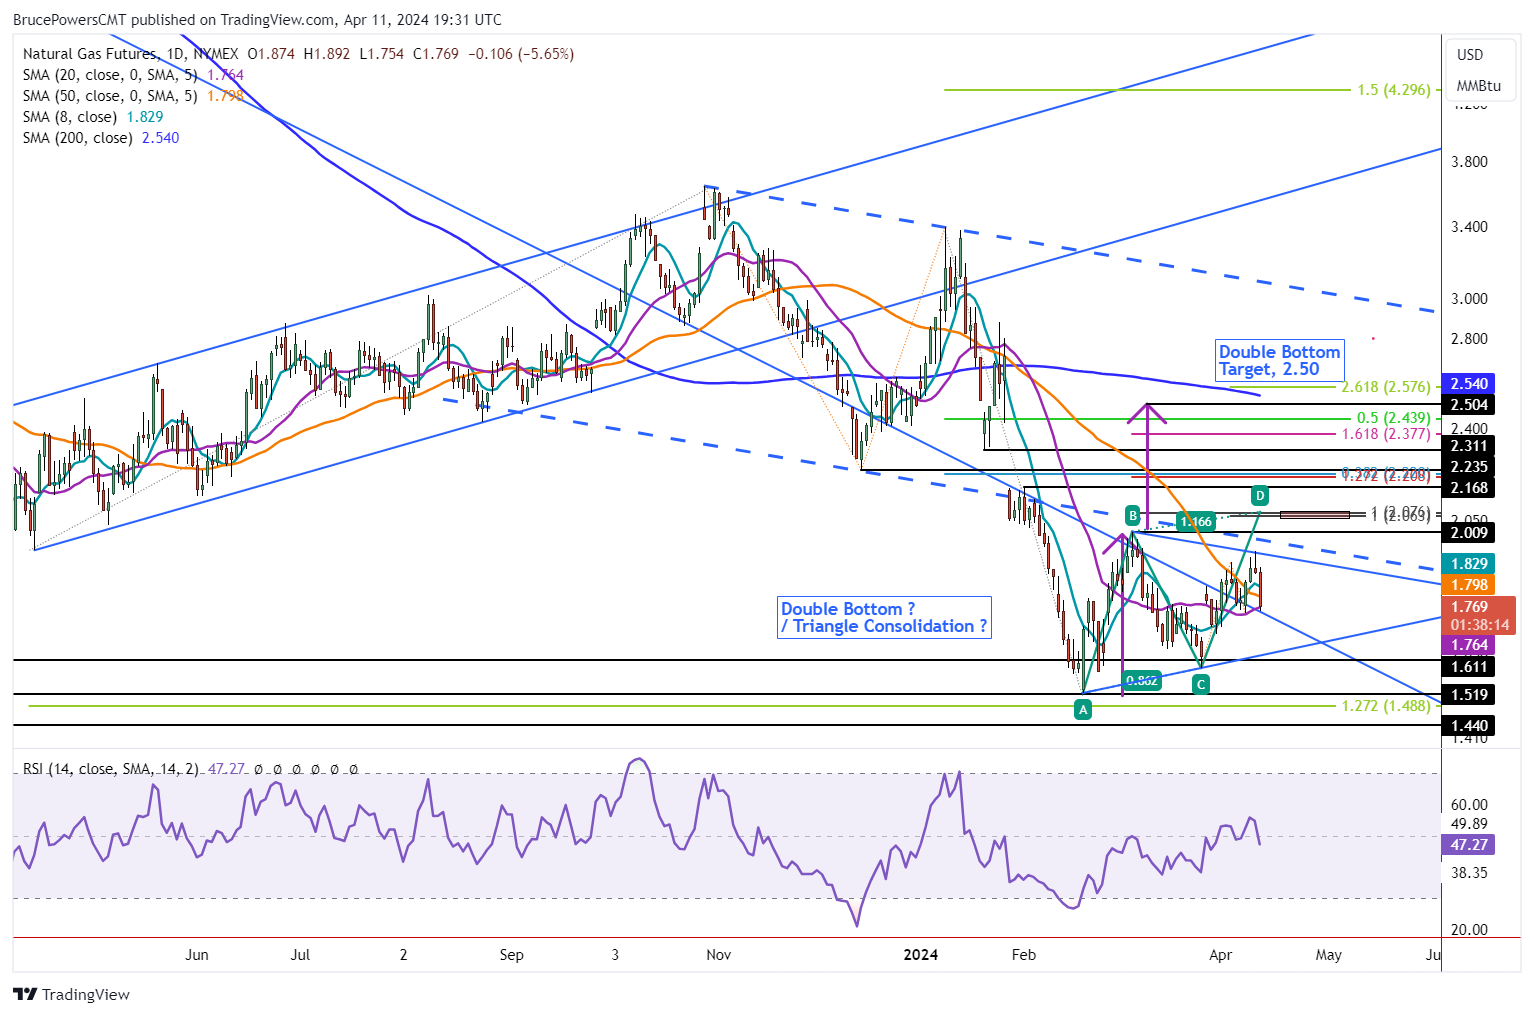
• Natural gas prices test support at 20-day MA, poised for bullish reversal or failure to lower prices.
Natural gas retreats further from Wednesday’s 1.94 high on Thursday as it tests support around the 20-day MA with the day’s low of 1.77. The 20-Day line is at 1.76 and it is strengthened by the long-term downtrend line, which marks the same price area. Notice that the 20-Day line and trendline have joined together. This should lead to a rejection of price to the upside, but there are no signs of it yet.
Moving Averages Show Improving Strength
Natural gas rallied back above the 20-Day line on April 1, and there was one subsequent successful test of support at the 20-Day MA. Today provides the second such test. A bounce and bullish reversal off the 1.76 price zone should complete the test and clear the way for natural gas to continue to advance. Over the past week the 8-Day MA has risen back above both the 20-Day and 50-Day MAs. And there was recently a higher swing low (C), reflecting improving demand.
Further Consolidation Possible Until Clear Breakout
Nevertheless, there is also a possibility that natural gas traces out a consolidation pattern. A bearish pennant or symmetrical triangle is the form now taking shape. It remains valid until there is an upside breakout above Wednesday’s high of 1.87. A drop below Monday’s low of 1.75 will increase the likelihood that consolidation may continue.
Rise Above 1.89 Shows Strength
Near-term resistance is now at today’s high of 1.89. A breakout above that high will provide the next sign of strength that could lead to a breakout above Wednesday’s high of 1.94. Once there is a daily close above that level natural gas should be ready to progress higher. The neckline for a potential double bottom bullish pattern is at 2.01 (B), with the first higher target zone around 2.06 to 2.08. Other target areas of interest are marked on the chart.
Weekly Chart, Bullish Signs
The weekly chart (not shown) is not a screaming buy, but it does show bullish progression. Last week’s close was relatively weak as it was in the lower half of the week’s trading range. Further, this week’s performance is also at risk of closing in the lower half of the week’s range. At the same time, this week’s low and last week’s both found support around the 8-Week MA, now at 1.73.
Read Full Story »»»
 DiscoverGold
Information posted to this board is not meant to suggest any specific action, but to point out the technical signs that can help our readers make their own specific decisions. Caveat emptor!
• DiscoverGold
NanoViricides Reports that the Phase I NV-387 Clinical Trial is Completed Successfully and Data Lock is Expected Soon • NNVC • May 2, 2024 10:07 AM
ILUS Files Form 10-K and Provides Shareholder Update • ILUS • May 2, 2024 8:52 AM
Avant Technologies Names New CEO Following Acquisition of Healthcare Technology and Data Integration Firm • AVAI • May 2, 2024 8:00 AM
Bantec Engaged in a Letter of Intent to Acquire a Small New Jersey Based Manufacturing Company • BANT • May 1, 2024 10:00 AM
Cannabix Technologies to Deliver Breath Logix Alcohol Screening Device to Australia • BLO • Apr 30, 2024 8:53 AM
Hydromer, Inc. Reports Preliminary Unaudited Financial Results for First Quarter 2024 • HYDI • Apr 29, 2024 9:10 AM

