


| Followers | 679 |
| Posts | 141062 |
| Boards Moderated | 36 |
| Alias Born | 03/10/2004 |
Tuesday, April 09, 2024 5:42:17 PM
By: Bruce Powers | April 9, 2024
• Natural gas showed strength by closing above its 50-Day MA, signaling potential demand increase.
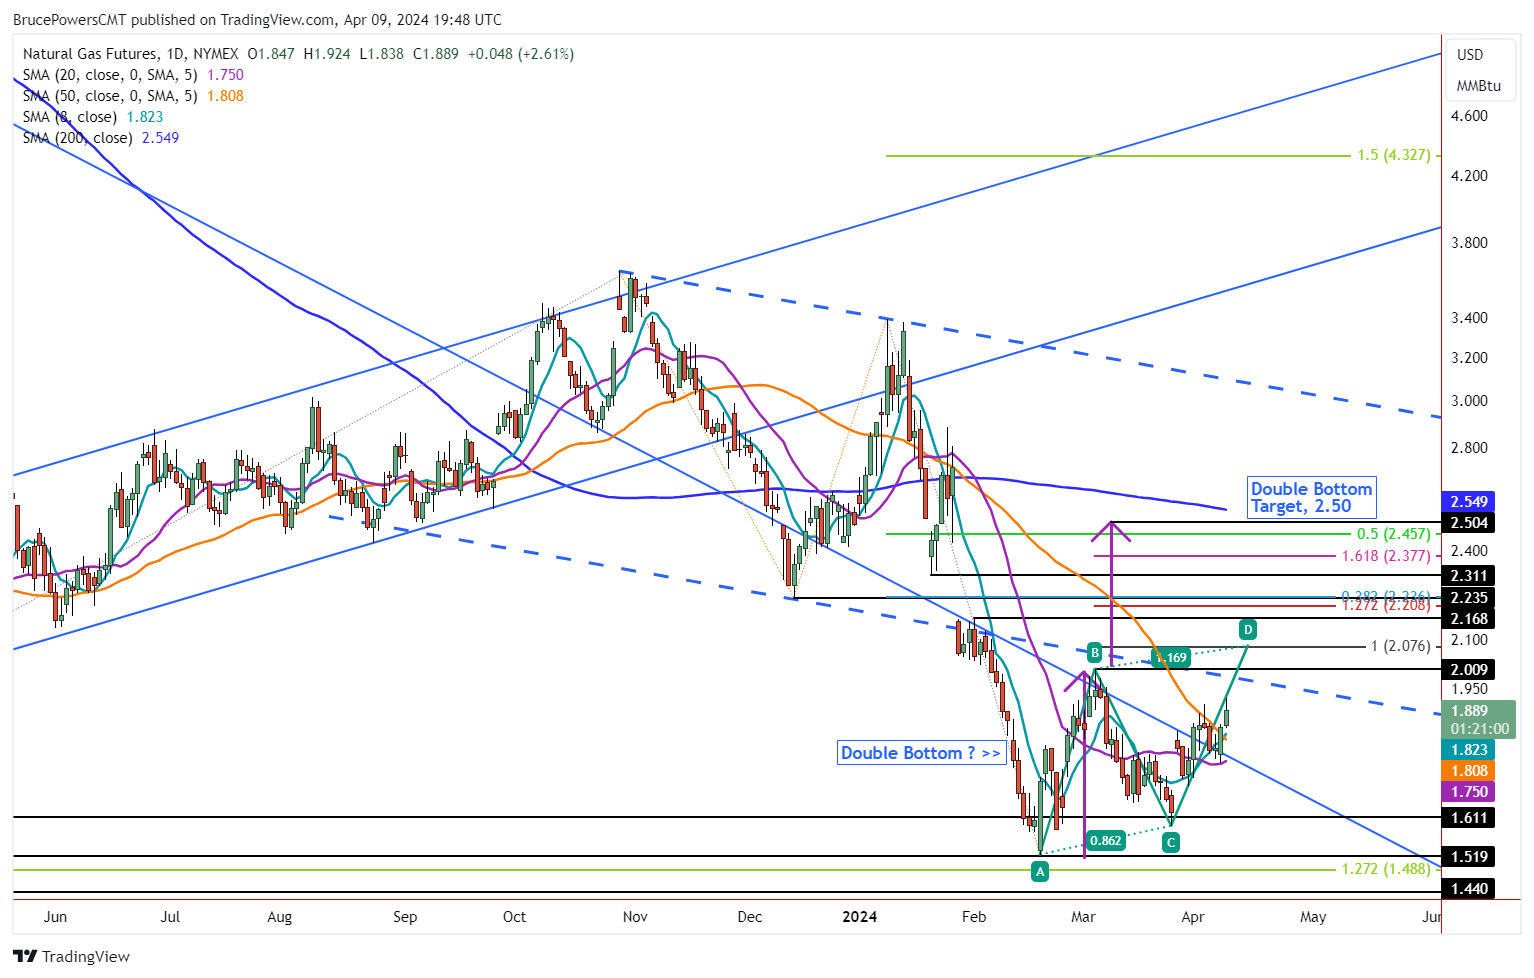
Natural gas closed above its 50-Day MA for the first time since mid-January on Monday. That is a sign of strength that should see demand increase in the coming days. A teaser occurred today as natural gas rallied above the recent 1.91 minor swing high before encountering resistance at the day’s high of 1.92. An intraday selloff followed back to the lows of the day. Where it closes relative to the day’s range should provide a clue as to current sentiment.
Advance Continues Following 50-Day MA Breakout
There was minor confirmation of strength since the breakout above the 50-Day MA, as the 8-Day MA crossed above the 50-Day today for the first time since mid-January, today. Also, yesterday the 20-Day MA was successfully tested as support for the first time since the price of natural gas rallied back above the 20-Day line on April 1.
That cleared the way for further strengthening, which we saw yesterday and then again today. What happens next will be key though as a failed breakout is always possible. A second daily close above the 50-Day line today would dampen that possibility. Then, we need to see signs of further strengthening if natural gas is going to have a chance at reaching higher targets.
Potential Double Bottom Setup
A rally above the 2.01 (B) swing high will trigger a breakout of a double bottom bullish reversal pattern and a continuation of the current developing uptrend. At that point there would be a higher swing high that would follow the recent higher swing low (C). The first identified target from current levels is the completion of a small rising ABCD pattern at 2.08.
At that price the CD leg of the advance will match the price appreciation seen in the first leg up, marked A to B. Once there is price symmetry a potential resistance zone has been reached. There are also interim price targets on the way up to the double bottom target of 2.50.
Higher Targets
The consolidation high following the large gap down in late-January is at 2.17. However, the more notable 38.2% Fibonacci retracement level is at 2.24. That price level takes on a somewhat greater significance since it is also match with prior support at the December swing low.
Read Full Story »»»
 DiscoverGold
Information posted to this board is not meant to suggest any specific action, but to point out the technical signs that can help our readers make their own specific decisions. Caveat emptor!
• DiscoverGold
NanoViricides Reports that the Phase I NV-387 Clinical Trial is Completed Successfully and Data Lock is Expected Soon • NNVC • May 2, 2024 10:07 AM
ILUS Files Form 10-K and Provides Shareholder Update • ILUS • May 2, 2024 8:52 AM
Avant Technologies Names New CEO Following Acquisition of Healthcare Technology and Data Integration Firm • AVAI • May 2, 2024 8:00 AM
Bantec Engaged in a Letter of Intent to Acquire a Small New Jersey Based Manufacturing Company • BANT • May 1, 2024 10:00 AM
Cannabix Technologies to Deliver Breath Logix Alcohol Screening Device to Australia • BLO • Apr 30, 2024 8:53 AM
Hydromer, Inc. Reports Preliminary Unaudited Financial Results for First Quarter 2024 • HYDI • Apr 29, 2024 9:10 AM

