


| Followers | 679 |
| Posts | 140973 |
| Boards Moderated | 36 |
| Alias Born | 03/10/2004 |
Thursday, January 25, 2024 11:19:05 PM
By: Bruce Powers | January 25, 2024
• Apple stock shows early signs of hitting resistance while Microsoft, a market leader, hits a $3 trillion market valuation, but a potential short-term pullback may happen soon.
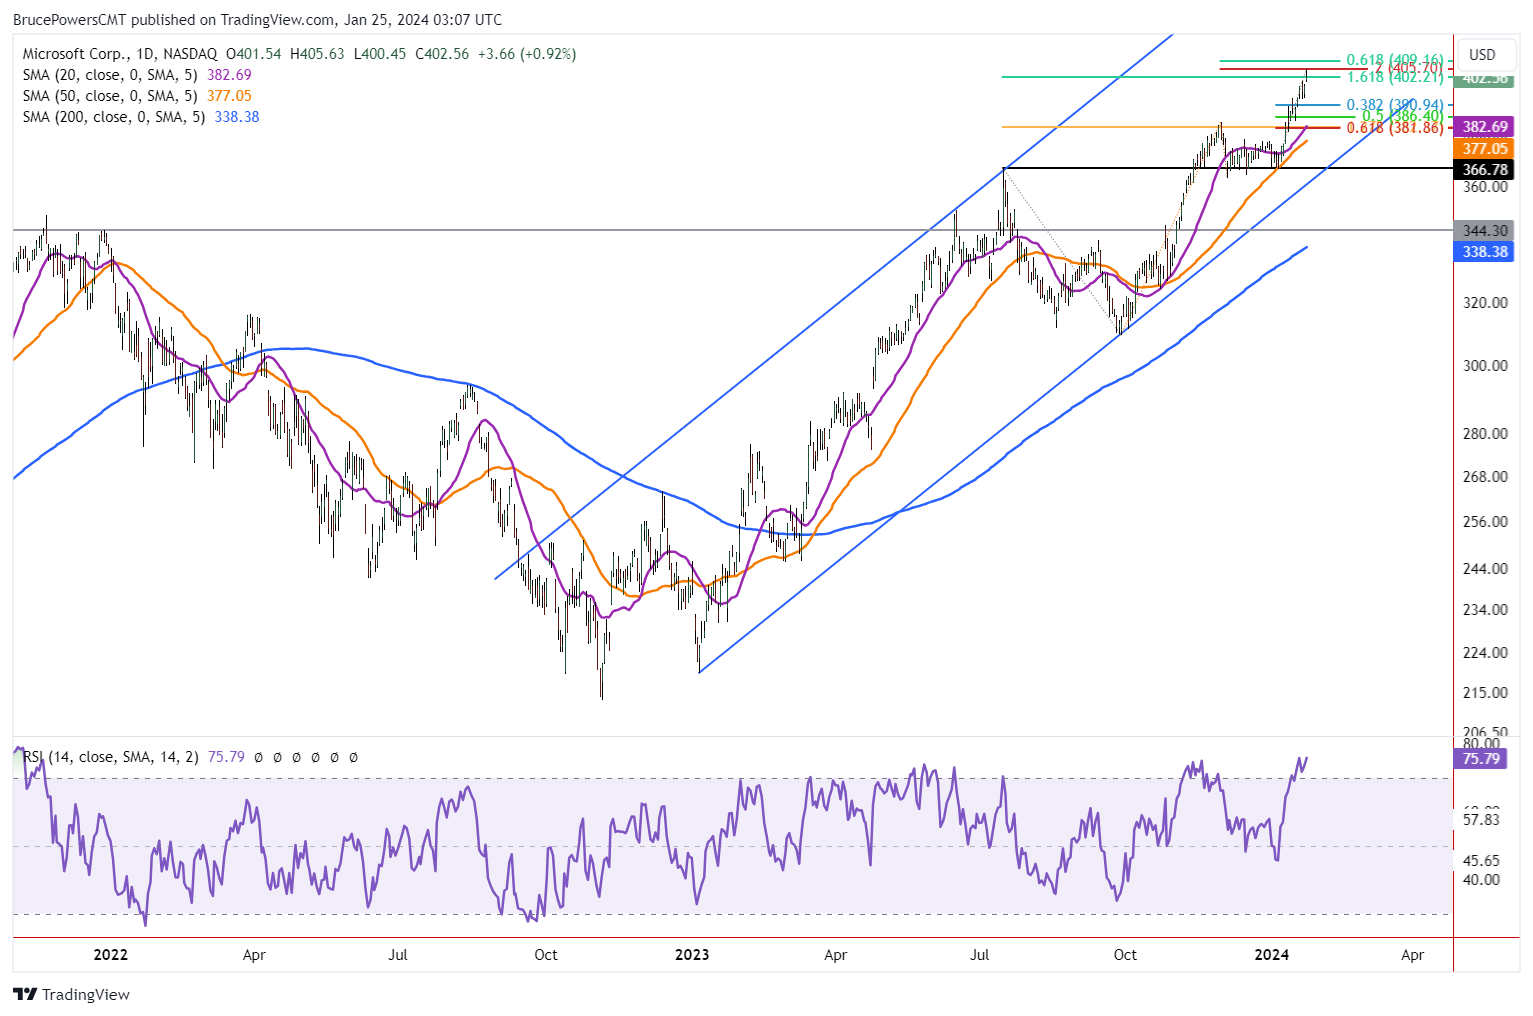
Microsoft Corp. (MSFT)
The stock of Microsoft was a market leader last year as well, and it remains so for the start of 2024. However, it may be ready for a pullback soon. On Wednesday, it reached a high of $405.63 and a new high market capitalization of $3 trillion dollars before pulling back. They are the second company to do so after Apple Corp. However, the high was almost an exact match with the completion of a 200% extension of the most recent retracement. In addition, several other Fibonacci targets levels are around that price increasing the chance to see signs of resistance as selling pressure builds. Wednesday closed weak with a possible bearish shooting candlestick pattern.
Microsoft is a Leader in the AI Revolution
Through its partnership with artificial intelligence (AI) company OpenAI, the maker of ChatGPT, Microsoft is at the forefront of the AI revolution. It has established itself as a leader in the sector with that partnership. Microsoft is scheduled to report earnings on January 30.
Retracement May Test 20-Day Moving Average Support
The most recent breakout level for Microsoft stock was $384.30. It corresponds to potential support around the 61.8% retracement of the most recent upswing at 381.86 and the 20-Day MA at $382.69. Microsoft stock broke out above the 20-Day line three weeks ago and it has not yet been tested as support. You can see how much of the month of December the 20-Day MA marked resistance. It would be healthy for the uptrend if the 20-Day line is tested as support. This does not mean it will be if a retracement kicks in, but it could.
Read Full Story »»»
 DiscoverGold
Information posted to this board is not meant to suggest any specific action, but to point out the technical signs that can help our readers make their own specific decisions. Caveat emptor!
• DiscoverGold
Recent MSFT News
- Alphabet CEO’s Billion-Dollar Wealth, Microsoft’s $1.7B Indonesia Investment, and More News • IH Market News • 04/30/2024 11:58:40 AM
- Axel Springer et Microsoft élargissent leur partenariat dans les domaines de la publicité, de l'IA, du contenu et des services de Microsoft Azure • PR Newswire (Canada) • 04/29/2024 03:00:00 PM
- Axel Springer and Microsoft expand partnership across advertising, AI, content and Azure services • PR Newswire (Canada) • 04/29/2024 03:00:00 PM
- Axel Springer and Microsoft expand partnership across advertising, AI, content and Azure services • PR Newswire (US) • 04/29/2024 03:00:00 PM
- U.S. Stocks May See Further Upside In Early Trading • IH Market News • 04/29/2024 01:05:53 PM
- Conduent Collaborates with Microsoft on Generative AI to Drive Innovation in Business Process Solutions • Business Wire • 04/29/2024 12:43:00 PM
- U.S. Futures Rise in Pre-Market Trading Amid Key Federal Reserve Meeting and Earnings Week Ahead • IH Market News • 04/29/2024 11:12:54 AM
- Philips Stocks Soar 47% Following US Deal, Tesla Bolsters Presence in China, and More News • IH Market News • 04/29/2024 11:11:24 AM
- U.S. Stocks Rally On Upbeat Tech Earnings • IH Market News • 04/26/2024 08:30:27 PM
- Exxon Mobil Net Profit Drops 28% to $8.22 Billion, Atlassian Surprises with Revenue Boost and Co-CEO Exit, and More in Earnings • IH Market News • 04/26/2024 11:47:51 AM
- U.S. Futures Climb in Pre-Market Trading Amid Tech Gains and Upcoming Inflation Data • IH Market News • 04/26/2024 11:47:25 AM
- The Estée Lauder Companies and Microsoft increase collaboration to power prestige beauty with generative AI • PR Newswire (US) • 04/26/2024 10:00:00 AM
- U.S. Stocks Climb Well Off Worst Levels But Close Mostly Lower • IH Market News • 04/25/2024 08:40:00 PM
- Microsoft earnings press release available on Investor Relations website • PR Newswire (US) • 04/25/2024 08:10:00 PM
- U.S. Futures Drop in Pre-Market Trading as Tech Stocks Plunge After Meta Issues Gloomy Forecast • IH Market News • 04/25/2024 11:53:54 AM
- BHP Bids $38.8 Billion for Anglo American; Biden Unveils Historic Micron Technology Deal, and More News • IH Market News • 04/25/2024 11:48:40 AM
- Coca-Cola and Microsoft Sign Billion-Dollar Agreement, Apple Event Set for May 7, and More News • IH Market News • 04/24/2024 11:28:02 AM
- Stocks Close On Firm Note For 2nd Straight Day On Earnings Hopes • IH Market News • 04/23/2024 09:00:38 PM
- The Coca-Cola Company and Microsoft announce five-year strategic partnership to accelerate cloud and generative AI initiatives • PR Newswire (US) • 04/23/2024 01:30:00 PM
- Futures Pointing To Extended Rebound On Wall Street • IH Market News • 04/23/2024 01:11:27 PM
- Apple Loses Market Share in China, GM Surges in Pre-Market Following Upward Revisions for 2024 Projections, and More News • IH Market News • 04/23/2024 11:25:34 AM
- U.S. Stocks Close On Bright Note Despite Coming Off Day’s Highs • IH Market News • 04/22/2024 08:38:04 PM
- Cognizant and Microsoft Announce Global Partnership to Expand Adoption of Generative AI In the Enterprise, And Drive Industry Transformation • PR Newswire (US) • 04/22/2024 12:30:00 PM
- Nasdaq, S&P 500 Extend Losing Streaks On Tech Weakness But Dow Advances • IH Market News • 04/19/2024 08:32:14 PM
- Paramount’s Shares Surge Following Sony and Apollo’s Joint Bid; ISS Backs Berkshire Hathaway Director Re-election, and More • IH Market News • 04/19/2024 11:31:22 AM
FEATURED Cannabix Technologies to Deliver Breath Logix Alcohol Screening Device to Australia • Apr 30, 2024 8:53 AM
Hydromer, Inc. Reports Preliminary Unaudited Financial Results for First Quarter 2024 • HYDI • Apr 29, 2024 9:10 AM
Avant Technologies to Implement AI-Empowered, Zero Trust Architecture in Its Data Centers • AVAI • Apr 29, 2024 8:00 AM
Bantec Reports an Over 50 Percent Increase in Sales and Profits in Q1 2024 from Q1 2023 • BANT • Apr 25, 2024 10:00 AM
Cannabix's Breath Logix Alcohol Device Delivers Positive Impact to Private Monitoring Agency in Montana, USA • BLO • Apr 25, 2024 8:52 AM
Kona Gold Beverages, Inc. Announces Name Change to NuVibe, Inc. and Initiation of Ticker Symbol Application Process • KGKG • Apr 25, 2024 8:30 AM

