


| Followers | 681 |
| Posts | 141438 |
| Boards Moderated | 35 |
| Alias Born | 03/10/2004 |
Thursday, November 30, 2023 9:08:44 AM
By: Karl Montevirgen | November 30, 2023
• MSFT stock price surges past its 52-week high but. pulls back, closing just shy of $379
• Investors should watch for dips and resistance-turned-support levels for long entries
• Microsoft's massive investment in OpenAI could help push the stock price higher
While Microsoft's (MSFT) Azure contends for the top spot in the cloud computing arena, trailing behind Amazon (AMZN), its $1 billion investment in OpenAI, and the hand it played in resolving the company's recent debacle, shows how prominently Microsoft is riding the AI tiger.
Investors, too, must be getting the message, as the market has pushed MSFT's stock beyond its 52-week high threshold.
The stock went above $379.00 in Wednesday's trading session, and, with no historical resistance ahead, anyone looking to go long might wonder where a good entry price to open a position might be, despite a slight pullback.
At the end of 2022 and the beginning of 2023, MSFT bounced off its 200-week simple moving average. At least that gave bulls a reference point, with both serving as ideal entry points (see weekly chart of MSFT below).
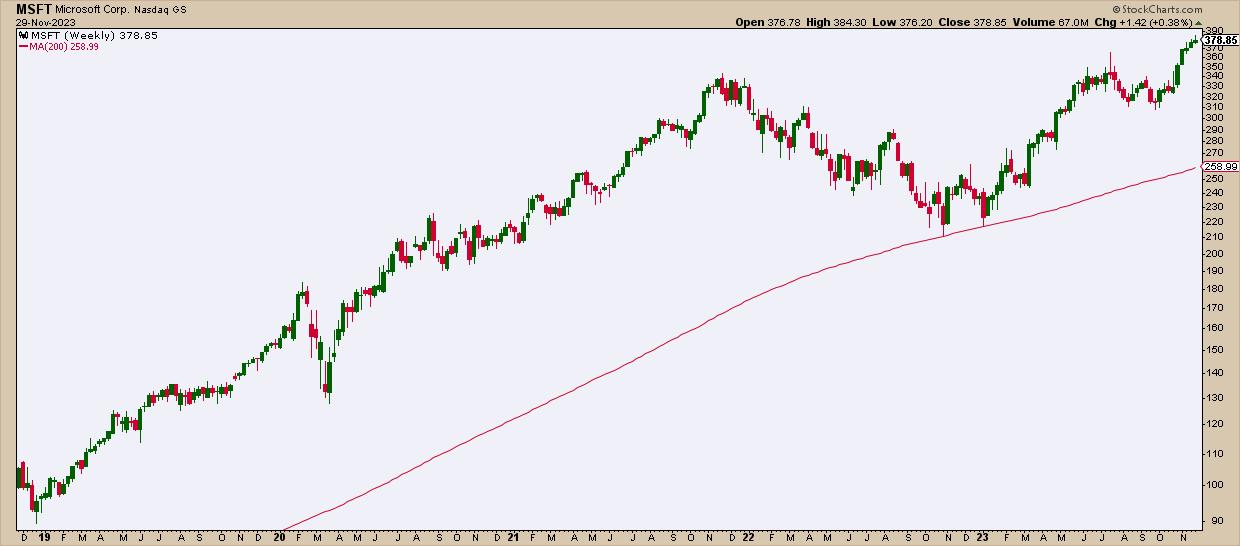
CHART 1: WEEKLY CHART OF MICROSOFT STOCK. The stock is in all-time high territory. Where to from here?
Chart source: StockCharts.com. For educational purposes.
But having broken above its all-time high threshold, it's hard to tell whether MSFT stock is skyrocketing or whether its sky-high valuations are subject to the forces of market gravity.
Also, fundamentally-based projections aren't much help here—they range anywhere from $390 to $450 a share. So, if you're looking to go long, it helps to assess whether the stock is currently overbought and if a dip might be forthcoming. For that, we'd have to look at the daily chart of MSFT stock (see below).

If you look at the relative strength index (RSI), now falling from 70, you can spot a slight divergence between the price rise and the RSI declining from "overbought" territory. MSFT may be pulling back now, but it's too early to tell if the pullback will continue in the coming sessions.
If it does continue to slide, we're looking at former resistance-turned-support levels as possible prices to anticipate a bullish bounce. This is punctuated by a thickening bullish Ichimoku Cloud, which, if you can remember, provides a range of potential support.
Why the cloud? The wider range complements the specific price support levels of $365 and $350. A pullback to this range, starting at the top-most $365 level and followed by a bounce, might provide you with an optimal entry point to get long MSFT, should you want to add it to your portfolio.
Note January 31, 2024 on your calendar. That's when MSFT drops its next earnings report. Right now, the buying craze is also centered on its ties with OpenAI. So keep an eye on any developments or news as we count down to January of the new year.
Read Full Story »»»
 DiscoverGold
Information posted to this board is not meant to suggest any specific action, but to point out the technical signs that can help our readers make their own specific decisions. Caveat emptor!
• DiscoverGold
Recent MSFT News
- CalPERS to Oppose Exxon Mobil Directors; Microsoft Unveils Copilot+ PCs with AI Focus, and More News • IH Market News • 05/21/2024 11:18:35 AM
- Coursera Announces Four New Entry-Level Certificates from Microsoft to Help Learners Pursue High-demand Jobs • Business Wire • 05/20/2024 12:30:00 PM
- Li Auto Stocks Drop Post Earnings; Calhoun Re-elected to Boeing Board, and More News • IH Market News • 05/20/2024 11:03:22 AM
- OpenAI’s Reddit Partnership Boosts Shares by 14%, Microsoft Embraces AMD Chips for AI, and More News • IH Market News • 05/17/2024 11:36:28 AM
- Chubb Stock Soars 9% with Berkshire Acquisition, AST SpaceMobile jumps 37% on AT&T deal, and More News • IH Market News • 05/16/2024 11:27:07 AM
- Buterin Proposes New Ethereum Fee Model, Unofficial Gamestop Memecoin Soars, and More Crypto News • IH Market News • 05/14/2024 06:56:21 PM
- Arm Sets 2025 Target for AI Chip Development, Amazon and Microsoft Commit Billions to French Investments, and More • IH Market News • 05/13/2024 11:16:03 AM
- Novavax Surges 57% Post $1.4 Billion Sanofi Deal; Apple Boosts Data Centers with AI and Internal Chips, and More News • IH Market News • 05/10/2024 12:02:56 PM
- Microsoft announces $3.3 billion investment in Wisconsin to spur artificial intelligence innovation and economic growth • PR Newswire (US) • 05/08/2024 01:45:00 PM
- Meta Platforms Expands AI Ads, Apple Boosts iPhone Shipments, and More Highlights • IH Market News • 05/08/2024 12:27:48 PM
- Microsoft and LinkedIn release the 2024 Work Trend Index on the state of AI at work • PR Newswire (US) • 05/08/2024 12:00:00 PM
- Tesla’s April Sales Down 18% in China, Amazon’s Multi-Billion Dollar Cloud Expansion in Singapore, and More News • IH Market News • 05/07/2024 11:44:00 AM
- Form EFFECT - Notice of Effectiveness • Edgar (US Regulatory) • 05/07/2024 04:15:33 AM
- Form 424B3 - Prospectus [Rule 424(b)(3)] • Edgar (US Regulatory) • 05/06/2024 08:20:48 PM
- Brookfield and Microsoft Collaborating to Deliver Over 10.5 GW of New Renewable Power Capacity Globally • GlobeNewswire Inc. • 05/01/2024 10:30:00 AM
- Alphabet CEO’s Billion-Dollar Wealth, Microsoft’s $1.7B Indonesia Investment, and More News • IH Market News • 04/30/2024 11:58:40 AM
- Axel Springer et Microsoft élargissent leur partenariat dans les domaines de la publicité, de l'IA, du contenu et des services de Microsoft Azure • PR Newswire (Canada) • 04/29/2024 03:00:00 PM
- Axel Springer and Microsoft expand partnership across advertising, AI, content and Azure services • PR Newswire (Canada) • 04/29/2024 03:00:00 PM
- Axel Springer and Microsoft expand partnership across advertising, AI, content and Azure services • PR Newswire (US) • 04/29/2024 03:00:00 PM
- U.S. Stocks May See Further Upside In Early Trading • IH Market News • 04/29/2024 01:05:53 PM
- Conduent Collaborates with Microsoft on Generative AI to Drive Innovation in Business Process Solutions • Business Wire • 04/29/2024 12:43:00 PM
- U.S. Futures Rise in Pre-Market Trading Amid Key Federal Reserve Meeting and Earnings Week Ahead • IH Market News • 04/29/2024 11:12:54 AM
- Philips Stocks Soar 47% Following US Deal, Tesla Bolsters Presence in China, and More News • IH Market News • 04/29/2024 11:11:24 AM
- U.S. Stocks Rally On Upbeat Tech Earnings • IH Market News • 04/26/2024 08:30:27 PM
- Exxon Mobil Net Profit Drops 28% to $8.22 Billion, Atlassian Surprises with Revenue Boost and Co-CEO Exit, and More in Earnings • IH Market News • 04/26/2024 11:47:51 AM
North Bay Resources Announces 50/50 JV at Fran Gold Project, British Columbia; Initiates NI 43-101 Resources Estimate and Bulk Sample • NBRI • May 21, 2024 9:07 AM
Greenlite Ventures Inks Deal to Acquire No Limit Technology • GRNL • May 17, 2024 3:00 PM
Music Licensing, Inc. (OTC: SONG) Subsidiary Pro Music Rights Secures Final Judgment of $114,081.30 USD, Demonstrating Strength of Licensing Agreements • SONGD • May 17, 2024 11:00 AM
VPR Brands (VPRB) Reports First Quarter 2024 Financial Results • VPRB • May 17, 2024 8:04 AM
ILUS Provides a First Quarter Filing Update • ILUS • May 16, 2024 11:26 AM
Cannabix Technologies and Omega Laboratories Inc. enter Strategic Partnership to Commercialize Marijuana Breathalyzer Technology • BLO • May 16, 2024 8:13 AM

