


| Followers | 689 |
| Posts | 143796 |
| Boards Moderated | 35 |
| Alias Born | 03/10/2004 |
Monday, June 05, 2023 3:56:34 PM
By: EWFTaha | June 5, 2023
Good Day Traders and Investors. In today’s article, we will look at the past performance of the 1 Hour Elliott Wave chart of Microsoft Corp. ($MSFT) The rally from 5.24.2023 low unfolded as a 5 wave impulse with an incomplete bullish sequence from 4.25.2023 low. So, we advised members to buy the pullback in 3 swings at the blue box area ($328.38 – 323.73). We will explain the structure & forecast below:
$MSFT 1H Elliott Wave Chart 6.01.2023:
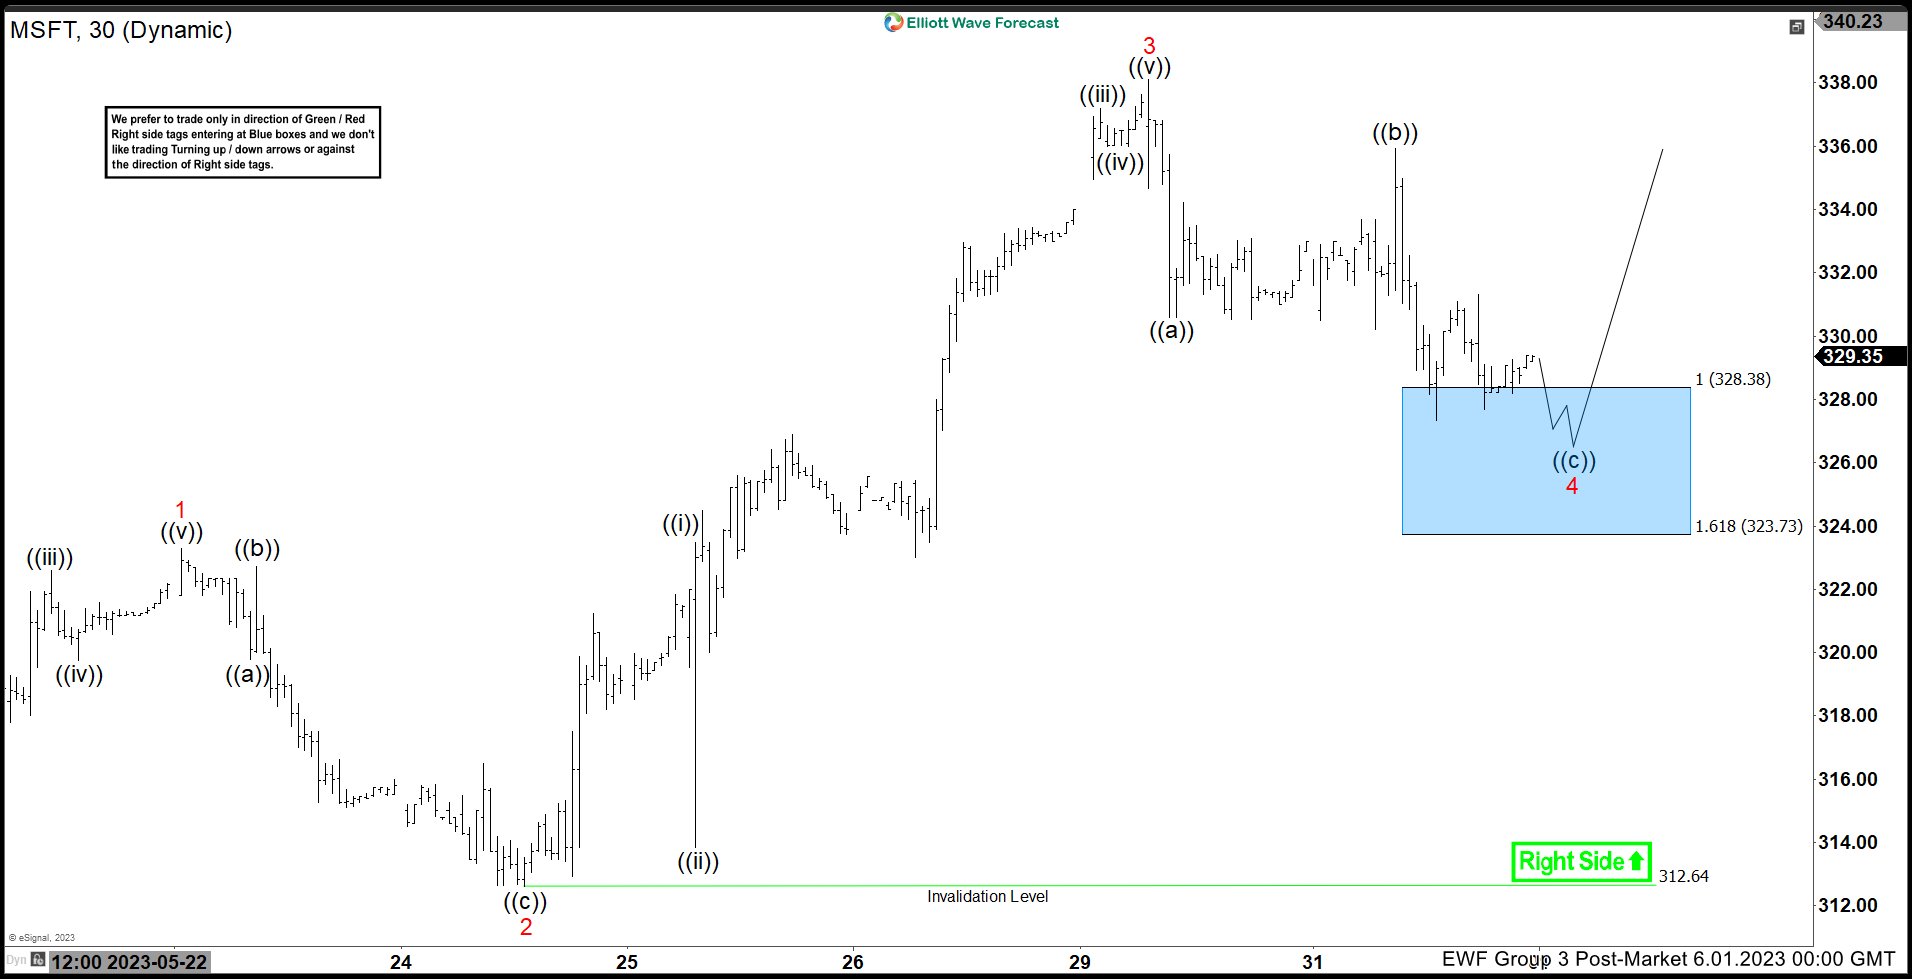
Here is the 1H Elliott Wave count from 6.01.2023. The rally from 5.24.2023 unfolded in a 5 wave impulse which signaled a bullish trend. We expected the pullback to find buyers in 3 swings at $328.38 – 323.73 where we entered as buyers.
$MSFT 1H Elliott Wave Chart Latest View:
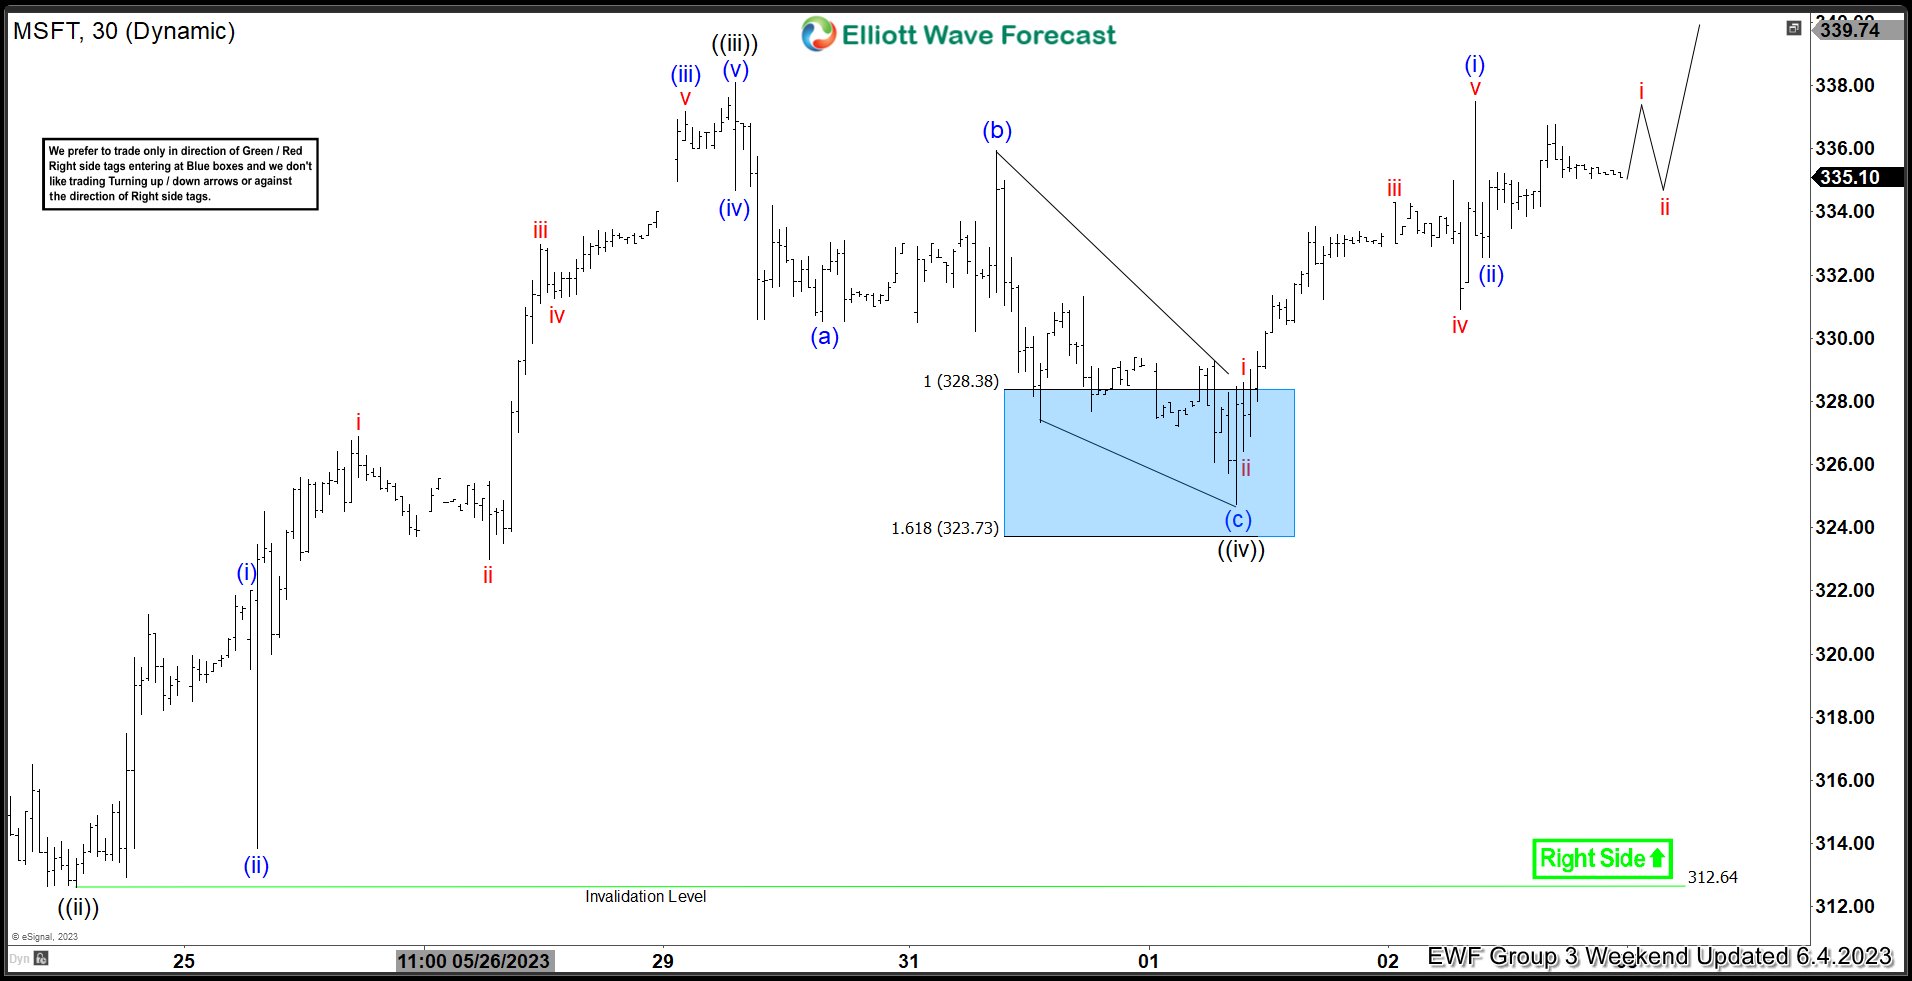
Here is the latest 1H update showing the move taking place as expected. The stock has reacted higher ending the cycle from 5.30.2023 peak and eventually breaking above it which confirms more upside is to be seen. We remain long with a risk free position targeting new all time highs and won’t be surprised to see $MSFT trading towards $380 – 435 area in the near term.
Read Full Story »»»
 DiscoverGold
Information posted to this board is not meant to suggest any specific action, but to point out the technical signs that can help our readers make their own specific decisions. Caveat emptor!
• DiscoverGold
Recent MSFT News
- Incase to Re-Launch Microsoft® PC Accessory Portfolio in 2024 • PR Newswire (US) • 08/29/2024 08:00:00 AM
- Form 4 - Statement of changes in beneficial ownership of securities • Edgar (US Regulatory) • 08/26/2024 10:01:30 PM
- IBM Closes China Research Division, Uber Fined $324M, Starliner to Return Without Astronauts • IH Market News • 08/26/2024 12:58:21 PM
- Form 144 - Report of proposed sale of securities • Edgar (US Regulatory) • 08/23/2024 08:27:59 PM
- Schwab and Snowflake Retreat in Premarket, WeRide Postpones IPO, Halliburton Cyberattack, McDonald’s Instagram Hack • IH Market News • 08/22/2024 09:37:42 AM
- Form 8-K - Current report • Edgar (US Regulatory) • 08/21/2024 08:08:55 PM
- Deutsche Bank Faces Shareholder Backlash, Bank of America Sponsors 2026 World Cup, Quanterix CEO Buys More Shares • IH Market News • 08/16/2024 10:03:21 AM
- TSMC July Revenue Surges 45%, Nasdaq Accelerates Penny Stock Delistings, Moody’s Downgrades Intel to BAA1, and More • IH Market News • 08/09/2024 09:44:44 AM
- Palantir and Microsoft Partner to Deliver Enhanced Analytics and AI Services to Classified Networks for Critical National Security Operations • Business Wire • 08/08/2024 10:59:00 AM
- Joby Aviation Seeks Australian Certification, Arcadium Lithium Projects Suspended Due to Oversupply, and More • IH Market News • 08/07/2024 09:47:32 AM
- Futures Pointing To Continued Strength On Wall Street • IH Market News • 08/01/2024 01:07:37 PM
- U.S. Stocks Rally On Upbeat Earnings News, Rate Cut Optimism • IH Market News • 07/31/2024 08:44:24 PM
- Upbeat Earnings News May Spark Early Rally On Wall Street • IH Market News • 07/31/2024 01:07:54 PM
- AMD Shares Surge 9% on Earnings Beat; Match Group Rises 10%, Pinterest & Lemonade Drop 13%, and More Earnings Updates • IH Market News • 07/31/2024 09:59:10 AM
- ASML Rises 7% on Export Waiver; Intel Plans Layoffs, HSBC $3B Buyback Announced, and More • IH Market News • 07/31/2024 09:55:50 AM
- Nasdaq Moves Sharply Lower As Tech Stocks Slump But Dow Moves Higher • IH Market News • 07/30/2024 08:53:52 PM
- Microsoft earnings press release available on Investor Relations website • PR Newswire (US) • 07/30/2024 08:08:00 PM
- Form 8-K - Current report • Edgar (US Regulatory) • 07/30/2024 08:03:22 PM
- Futures Pointing To Another Lackluster Session On Wall Street • IH Market News • 07/30/2024 01:23:43 PM
- U.S. Futures Climb Before Fed Meeting; Oil Prices Drop on China Demand Worries • IH Market News • 07/30/2024 10:06:14 AM
- F5 Shares Rise 15%; Diageo Falls 10% on Annual Sales Decline; BP Boosts Dividend and Buyback Program • IH Market News • 07/30/2024 10:03:59 AM
- U.S. Stocks Finish Choppy Trading Session Little Changed • IH Market News • 07/29/2024 08:44:00 PM
- Form PX14A6G - Notice of exempt solicitation submitted by non-management • Edgar (US Regulatory) • 07/29/2024 04:09:52 PM
- Optimism About Tech Earnings, Rate Cut May Lead To Strength On Wall Street • IH Market News • 07/29/2024 01:11:40 PM
- How AI is Transforming Marketing: Key Stocks to Watch in a $40B Industry • PR Newswire (Canada) • 07/29/2024 12:38:00 PM
Element79 Gold Corp Appoints Warren Levy to Board of Directors • ELMGF • Aug 28, 2024 9:51 AM
Integrated Ventures Announces Strategic Entry Into Health & Wellness Industry with Focus on GLP-1 Products • INTV • Aug 28, 2024 8:30 AM
ELEMENT79 ANNOUNCES UPLISTING TO OTCQB VENTURE MARKET • ELMGF • Aug 26, 2024 10:03 AM
North Bay Resources Announces Gold Assays up to 2.2 Ounces per Ton, Fran Gold Project, British Columbia • NBRI • Aug 26, 2024 10:00 AM
PickleJar Unveils Latest Venue Managed Services Innovations in Upcoming Webinar • PKLE • Aug 23, 2024 1:11 PM
Element79 Gold Corp Provides Update on Nevada Portfolio • ELMGF • Aug 23, 2024 8:00 AM

