


| Followers | 679 |
| Posts | 140848 |
| Boards Moderated | 36 |
| Alias Born | 03/10/2004 |
Monday, April 17, 2023 8:13:54 PM
By: Karl Montevirgen | April 17, 2023
If you plan on running up that hill, a pair of Nikes (NKE) could be the right fit for the task. But now, Nike is tackling a similar scenario, running up a Three Rising Valleys pattern—three consecutive higher lows (more on that later). Does the company have enough momentum to get beyond the current technical hurdle and once again reach its November 2021 peak -- $179.10 per share -- from the prevailing $125 price range? (See chart of NKE below.)
What's the Fundamental Story?
Nike has beaten analyst earnings expectations over the last 12 consecutive quarters. Its last drop, a negative earnings surprise, occurred in its fiscal Q4 2020 quarter—a massive 38% drop (loss of $790 million) during the global Covid-19 lockdown.
It's been recovering since, though sales to its third largest market, China, remain soft. Its last reported earnings report on March 21 was pretty outstanding. Nike did really well in their third fiscal quarter of 2023 compared to what financial experts on Wall Street predicted. Earnings per share and revenue came in higher than analyst estimates.
How's the Road Looking Ahead?
The road to recovery in China still has a few hurdles, but Nike CEO John Donahoe expects things to improve. As for global sales, Nike saw double-digit growth in the US, Latin America, Europe, Africa, Asia-Pacific, and the Middle East.
Also, Nike has really been putting a lot of work into growing their direct-to-consumer sales. They've been pouring money into cool experiential stores, working on their loyalty program, and increasing their e-commerce sales. It's been costly, but sales have accelerated as a result.
Running With the Bulls
On the technical side, Nike formed a Three Rising Valleys formation.
Popularized by technical analyst Thomas Bulkowski, Three Rising Valleys is a bullish chart pattern that signals a potential upward trend in the market. The pattern consists of three consecutive valleys (or troughs) that form within an existing uptrend. Each valley is slightly higher than the previous one, suggesting that buying interest is increasing, and the price is likely to continue rising.
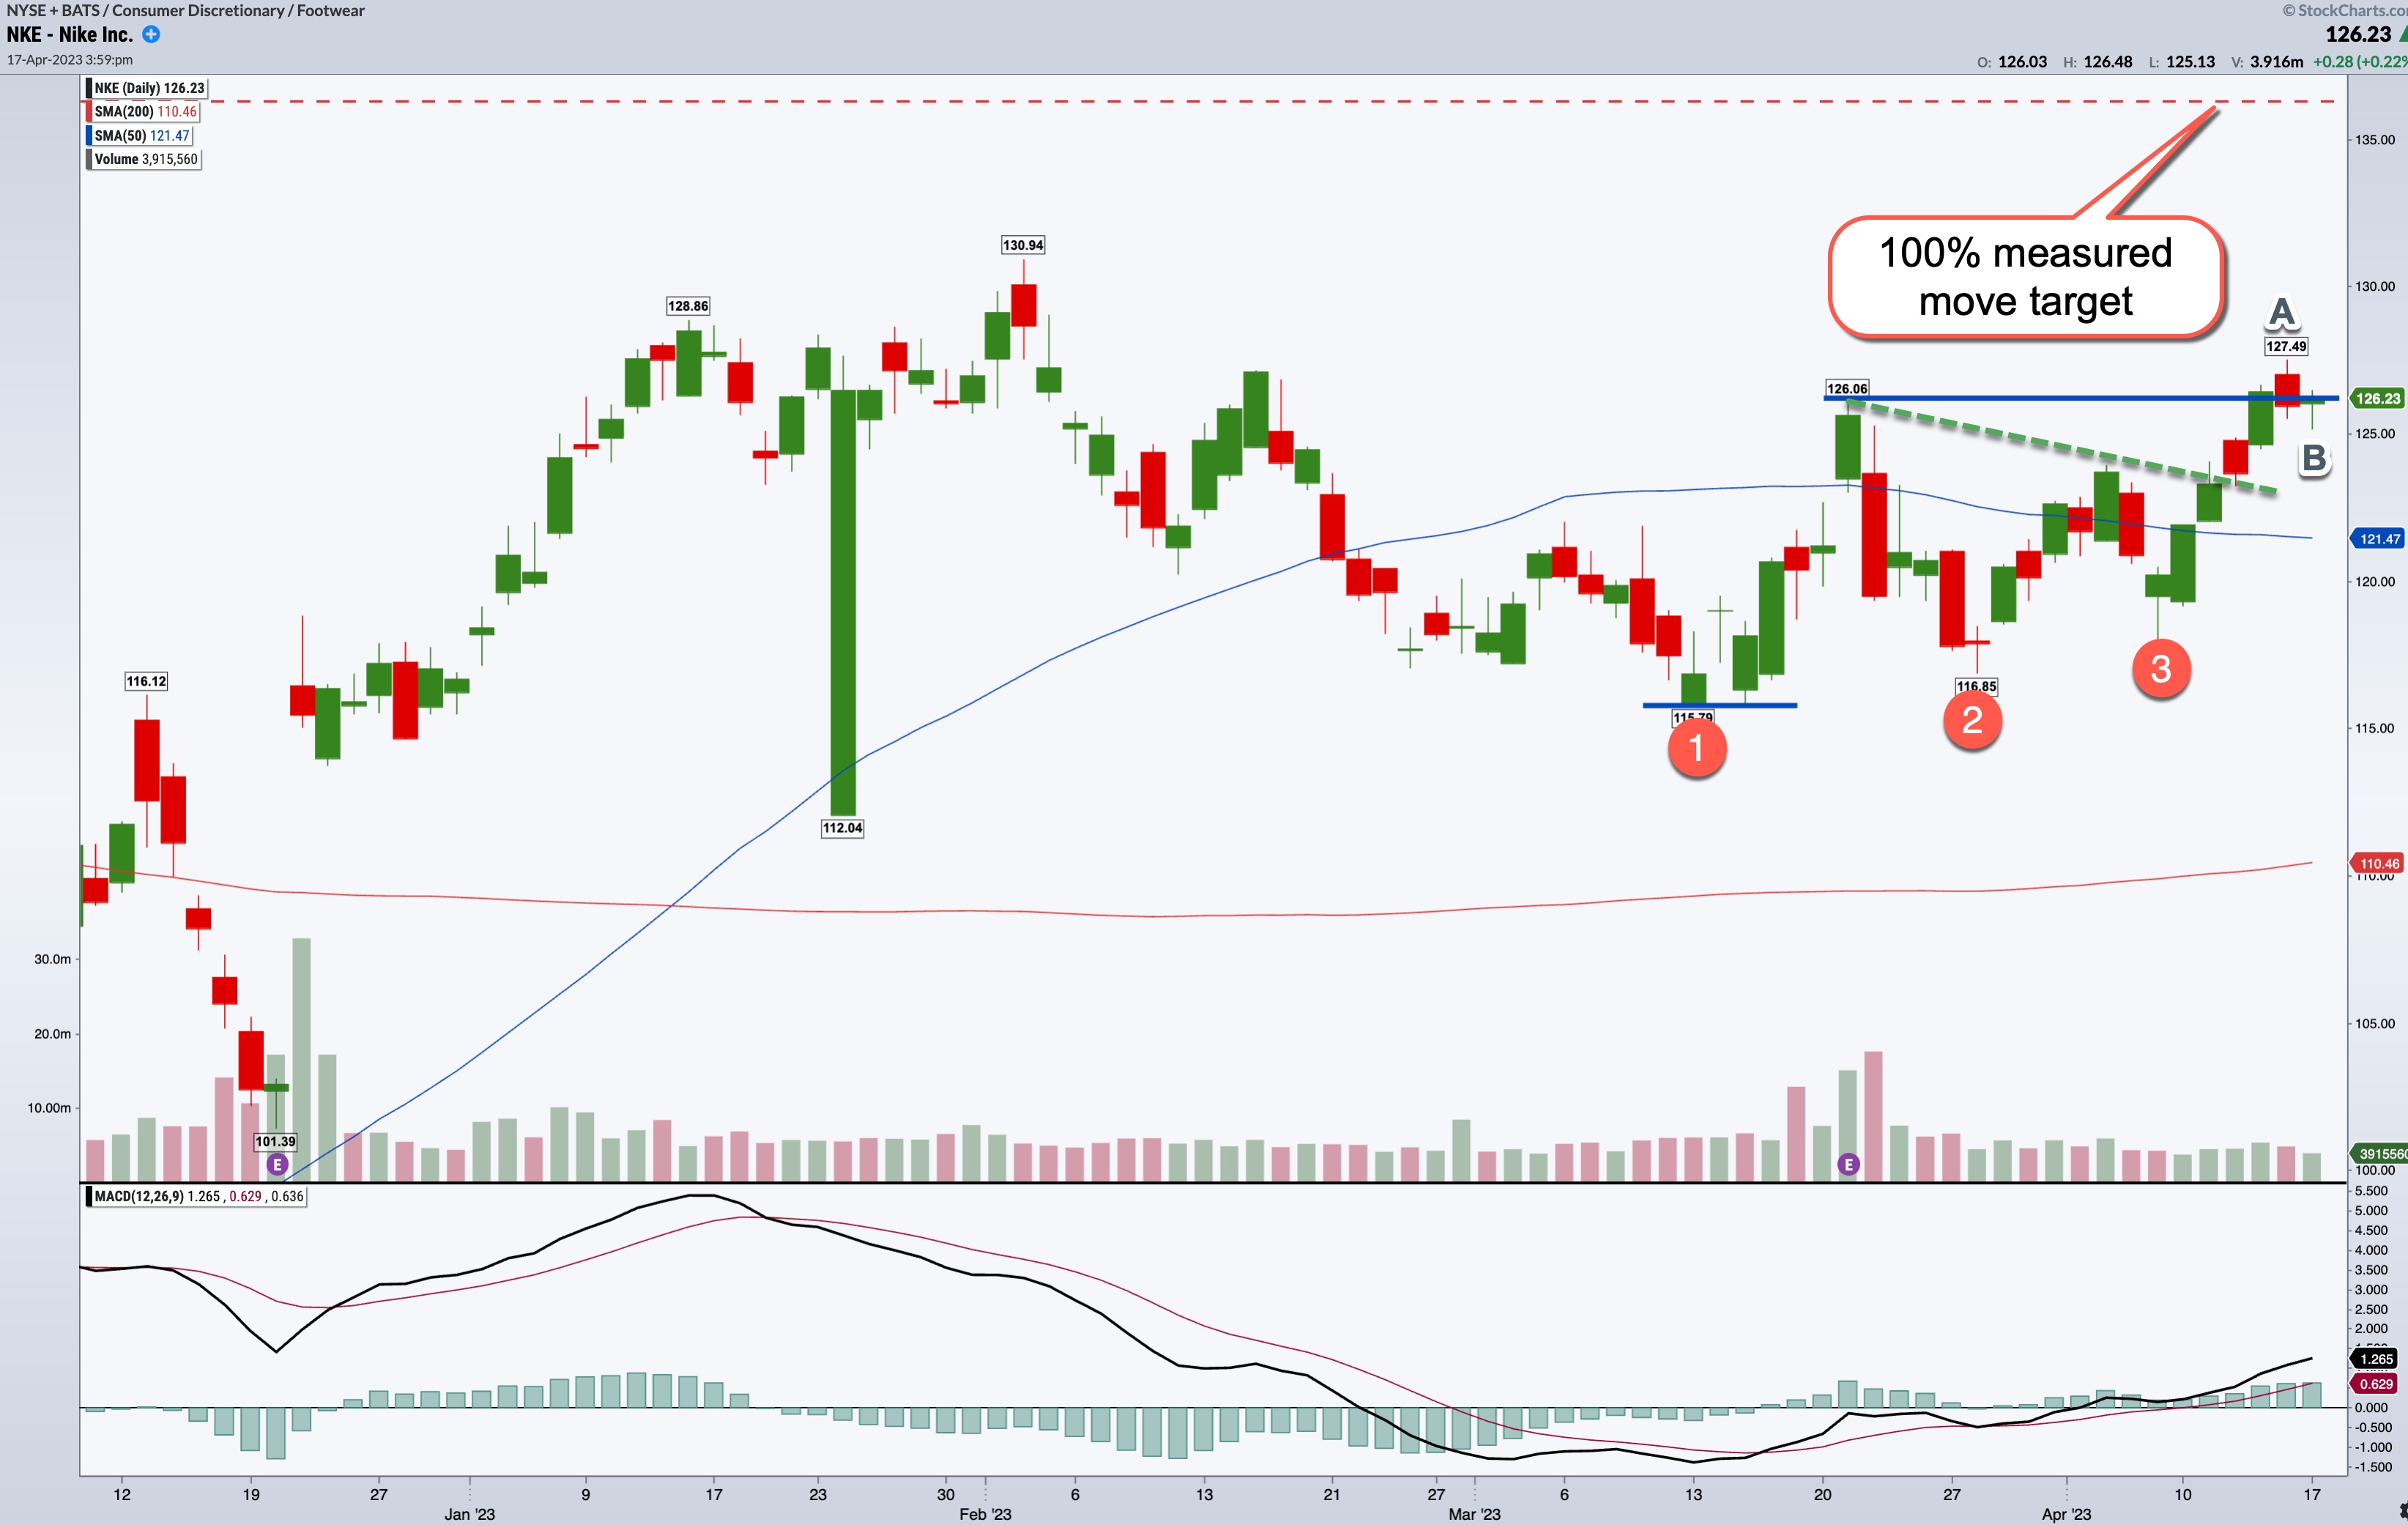
CHART 1: NIKE STOCK'S THREE RISING VALLEYS PATTERN. The stock could move as high as the 100% measured move target, which is around $136 (red dashed line).
Chart source: StockChartsACP. For educational purposes only.
How Do You Trade NKE Stock?
With this pattern, you'd take an altered measured approach (according to the description in Bulkowski's book Encyclopedia of Chart Patterns).
Entry point
• You would enter a long position at [A], a breakout above the top of the formation.
• For early entries, a breakout above the green line at [B] would also work.
Price targets
As far as price targets are concerned, here's how you'd calculate it. Start by subtracting the top of the formation (126.06) from the bottom (115.79), then add the difference (10.27) to the top. The targets will thus vary based on the 100% measure of 136.33 (or just 136 to round off). You can see where that level is on the chart (see red dashed line). Stop losses are usually placed at the bottom of the formation.
Note: Traders' target price preferences will vary anywhere from 60% to 100% of the target.
Looking at other technical indicators to contextualize this formation, the 50-day simple moving average (SMA) crossed the 200-day SMA a few months back, forming a Golden Cross. We also see the Moving Average Convergence/Divergence (MACD) looking favorable, with the MACD line having crossed above the signal line, and both crossing above the zero line.
But there's also a drop in volume. Price has pulled back, but volume has also dwindled. If price breaks above the formation, look at volume to assess Nike's momentum.
This pattern generally has a low failure rate (instances where it doesn't yield a rally of a specific magnitude, such as five or 10 percent). However, there are occasions when the pattern doesn't generate the anticipated rally. So it may be worth incorporating other indicators to confirm the upward move before entering the trade.
The Bottom Line
So overall, Nike's stock is showing some favorable prospects, beating earnings expectations as it continues to focus on growing its direct-to-consumer sales. While there are challenges in China, Nike's global sales look promising. The Three Rising Valleys pattern suggests a potential upward trend, but keep an eye on volume and other indicators to confirm it. If it runs bullish, monitor its progress and momentum. Remember, trading is about engaging risk; so stay alert and manage your trade as needed.
Read Full Story »»»
 DiscoverGold
Information posted to this board is not meant to suggest any specific action, but to point out the technical signs that can help our readers make their own specific decisions. Caveat emptor!
• DiscoverGold
Recent NKE News
- Li Auto Stock Drops 7.3% Amid Tesla Price Cuts, Salesforce Retreats from Informatica Deal, and Other Market Updates • IH Market News • 04/22/2024 12:09:21 PM
- Paramount’s Shares Surge Following Sony and Apollo’s Joint Bid; ISS Backs Berkshire Hathaway Director Re-election, and More • IH Market News • 04/19/2024 11:31:22 AM
- Paramount Global Board Shrinks, Morgan Stanley Faces Regulatory Probe, and More News • IH Market News • 04/12/2024 11:05:29 AM
- Nike Kicks Off Multi-Year Innovation Cycle • Business Wire • 04/11/2024 06:01:00 PM
- Costco Increases Dividend by 14%, Meta Introduces ‘Artemis’ AI Chip, and More News • IH Market News • 04/11/2024 11:24:54 AM
- Tech Sector Weakness May Weigh On Wall Street • IH Market News • 03/25/2024 01:26:54 PM
- U.S. Stocks Close Mixed On The Day But Sharply Higher For The Week • IH Market News • 03/22/2024 08:40:00 PM
- FedEx Soars 13% with Profits Above Forecasts, Nike Hit by China Slowdown, and Latest News • IH Market News • 03/22/2024 01:07:53 PM
- NIKE, Inc. Reports Fiscal 2024 Third Quarter Results • Business Wire • 03/21/2024 08:15:00 PM
- U.S. Index Futures Rise as Fed’s Dovish Outlook Spurs Positive Investor Sentiment; Oil Prices See Minor Declines • IH Market News • 03/21/2024 11:26:38 AM
- Apple Pre-Market Drop Due to Antitrust Threats, Surprising Profit Boosts Micron Shares, and Latest Market Updates • IH Market News • 03/21/2024 11:17:26 AM
- Form 8-K - Current report • Edgar (US Regulatory) • 03/11/2024 08:30:45 PM
- Futures Pointing To Continued Weakness On Wall Street • IH Market News • 03/05/2024 02:03:27 PM
- NIKE, Inc. Announces Third Quarter Fiscal 2024 Earnings and Conference Call • Business Wire • 02/22/2024 09:15:00 PM
- Form 4 - Statement of changes in beneficial ownership of securities • Edgar (US Regulatory) • 02/16/2024 09:33:40 PM
- Nike Workforce Reduction, The Trade Desk Soars 19% on $606 Million Revenue, and Latest News • IH Market News • 02/16/2024 11:08:22 AM
- Form 144 - Report of proposed sale of securities • Edgar (US Regulatory) • 02/14/2024 03:36:33 PM
- Form 4 - Statement of changes in beneficial ownership of securities • Edgar (US Regulatory) • 02/13/2024 09:31:34 PM
- Form 4 - Statement of changes in beneficial ownership of securities • Edgar (US Regulatory) • 02/13/2024 09:29:17 PM
- NIKE, Inc. Declares $0.370 Quarterly Dividend • Business Wire • 02/08/2024 09:46:00 PM
- Wall Street Highlights: Vroom Shuts Down Online Car Sales, Ericsson Warns of Decline Outside China, and More • IH Market News • 01/23/2024 10:40:18 AM
- Form 4 - Statement of changes in beneficial ownership of securities • Edgar (US Regulatory) • 01/12/2024 09:19:41 PM
- Crypto: UBS Imposes BTC ETF Trading Restrictions, CoinShares Acquires Valkyrie’s ETF, and More • IH Market News • 01/12/2024 06:50:44 PM
- Wall Street Highlights: Mastercard’s Financial Rise, Citigroup’s $3.8 Billion Charges, and More • IH Market News • 01/11/2024 11:18:22 AM
- On Holding Says Tiger Woods Not Partnering With Them • Dow Jones News • 01/08/2024 05:21:00 PM
FEATURED Cannabix's Breath Logix Alcohol Device Delivers Positive Impact to Private Monitoring Agency in Montana, USA • Apr 25, 2024 8:52 AM
Bantec Reports an Over 50 Percent Increase in Sales and Profits in Q1 2024 from Q1 2023 • BANT • Apr 25, 2024 10:00 AM
Kona Gold Beverages, Inc. Announces Name Change to NuVibe, Inc. and Initiation of Ticker Symbol Application Process • KGKG • Apr 25, 2024 8:30 AM
Axis Technologies Group and Carbonis Forge Ahead with New Digital Carbon Credit Technology • AXTG • Apr 24, 2024 3:00 AM
North Bay Resources Announces Successful Equipment Test at Bishop Gold Mill, Inyo County, California • NBRI • Apr 23, 2024 9:41 AM
Epazz, Inc.: CryObo, Inc. solar Bitcoin operations will issue tokens • EPAZ • Apr 23, 2024 9:20 AM

