


| Followers | 686 |
| Posts | 142814 |
| Boards Moderated | 35 |
| Alias Born | 03/10/2004 |
Tuesday, December 27, 2022 11:07:46 AM
By: Investing.com | December 27, 2022
ExxonMobil (NYSE:XOM), a significant component in the United States Oil Fund (NYSE:USO), announced on Dec. 8 that it would expand its share buyback program to $50bn over the next three years.
The decision comes as the U.S. oil and gas industry experiences an increase in profits due to rising energy prices, despite criticism on Oct. 28 from President Joe Biden that profits should not be used for dividends or stock buybacks while "a war is raging." This presidential attack follows Biden's chiding the industry since June for profits amid high inflation.
Despite this backlash, ExxonMobil's focus on returning profits to shareholders through its share buyback program has contributed to the company's strong performance in the market this year, with shares up over 77% even as the S&P 500 has declined.
In addition to the share buyback program, ExxonMobil will also increase its spending on energy projects and low-carbon initiatives, including carbon capture and storage, biofuels, and hydrogen, in the coming years.
However, the USO fund, which holds ExxonMobil, has been volatile and may not be a suitable option for retail investors looking for consistent returns with lower risk. Energy stocks or broad-based sector ETFs may be better options.
Global oil prices have recently fallen more than 20% due to a deteriorating outlook for oil consumption. This decline is consistent with a cyclical downturn in the oil market and the potential onset of a business cycle slowdown or recession.
High oil prices and a slowing economy have caused a reduction in consumption. Initially, the impact of this decline was masked by concerns about a planned price cap on Russia's crude and refined product exports.
Still, as it became clear that the cap would be introduced at a relatively high level with a relaxed approach to enforcement, the underlying deterioration in consumption was revealed, leading to a sharp drop in prices.
Additionally, hedge funds and other money managers have significantly reduced their positions in petroleum futures and options contracts, particularly in Brent crude, further contributing to the price decline.
The current situation bears some similarities to the oil market downturn in 2014. Still, the recent downturn is occurring in the context of a global recession, and the factors driving it are more complex and diverse.
On Oct. 6, I provided a bullish call on XOM. Having actualized its target, I'm now giving risk parameters for a bearish call.
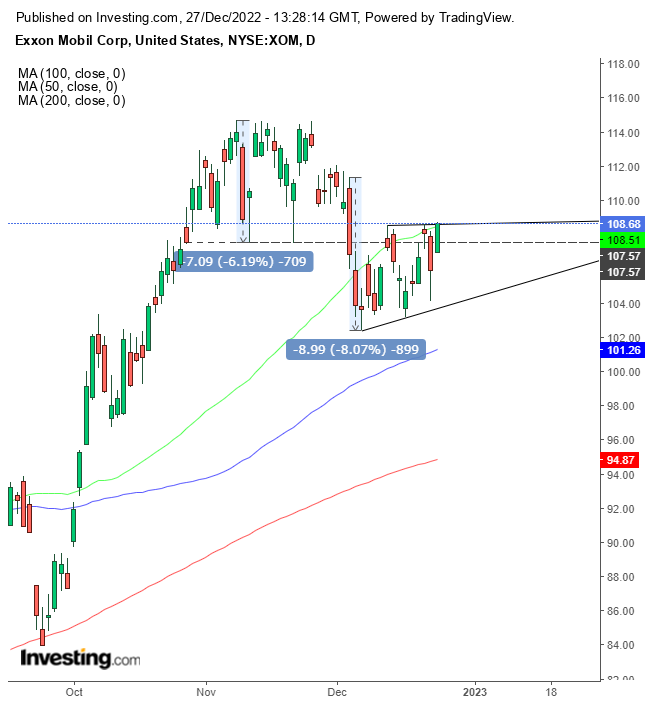
XOM Daily Chart
It's noteworthy that ExxonMobil failed to maintain gains after the Dec. 8 announcement, even as the broader market gained. Oil dropped that day, despite China's easing its zero-COVID policy. The market narrative argued that traders were losing faith in the commodity.
The price has been developing a rising flag after topping. The flag's top is a return move confirming the top's neckline. On Friday, the flag top/top's neckline resisted the price for the third time.
The top's height implies a $7 move from the $107 breakout point, implying a $100 target, suggesting the flag's completion with a downside breakout.
The flagpole - the drop before the range - is what technicians use as a target, as the same interested parties are expected to repeat the downside move upon breakout, implying a $9 plunge from the breakout point to somewhere around $95.
Note how the current resistance is 50 DMA, and the implied target is 200 DMA, with the 100 DMA supporting the flag.
Trading Strategies
Conservative traders should wait for the price to fall below the 100 DMA, then retest the flag's resistance.
Moderate traders would sell upon a rally off the 100 DMA.
Aggressive traders could sell now, provided they accept the higher risk proportionate with the higher reward of moving before the rest of the market as it awaits confirmation.
Read Full Story »»»
 DiscoverGold
Information posted to this board is not meant to suggest any specific action, but to point out the technical signs that can help our readers make their own specific decisions. Caveat emptor!
• DiscoverGold
Recent XOM News
- Berkshire Sells BofA Holdings, Ryanair Shares Drop 12%, Delta Still Struggling After IT Disruption • IH Market News • 07/22/2024 09:44:17 AM
- BP Slashes Profit Forecast by $700 Million; Morgan Stanley Predicts S&P 500 10% Drop, and More News • IH Market News • 07/09/2024 10:54:32 AM
- Form 8-K - Current report • Edgar (US Regulatory) • 07/08/2024 11:07:33 AM
- Paramount-Skydance $28B Merger, Boeing Agrees to Plead Guilty with $243.6M Fine, and More News • IH Market News • 07/08/2024 10:37:52 AM
- Apple Joins OpenAI Board, Logitech President Opts Out of Reelection, and More News • IH Market News • 07/03/2024 10:59:39 AM
- Doordash and Deliveroo Terminate Talks; Universal Announces UK Theme Park Plan, and More News • IH Market News • 06/26/2024 11:08:35 AM
- ExxonMobil and EV battery maker SK On sign MOU regarding U.S. produced Mobil™ Lithium • Business Wire • 06/25/2024 02:00:00 PM
- ExxonMobil Adds Air Liquide to World’s Largest Low-Carbon Hydrogen Project • Business Wire • 06/24/2024 03:45:00 PM
- Honeywell Acquires CAES Systems for $1.9 Billion, Sarepta Therapeutics Surges 34%, Gilead Continues Gains • IH Market News • 06/21/2024 12:00:38 PM
- Form 4 - Statement of changes in beneficial ownership of securities • Edgar (US Regulatory) • 06/20/2024 01:38:43 PM
- Fisker Files for Bankruptcy, Chegg Stocks Rise on 23% Workforce Reduction, and More • IH Market News • 06/18/2024 11:02:13 AM
- Craig Morford to Retire as Vice President, General Counsel and Secretary; Jeff Taylor Elected as Vice President, General Counsel and Secretary • Business Wire • 06/12/2024 12:00:00 PM
- LiTHOS Announces Execution of Letter of Intent for Technology to Launch TiERRA™ Re-Injection Service • PR Newswire (US) • 06/06/2024 12:37:00 PM
- LiTHOS Announces Execution of Letter of Intent for Technology to Launch TiERRA™ Re-Injection Service • PR Newswire (Canada) • 06/06/2024 12:37:00 PM
- Nvidia Becomes 2nd Most Valuable Company in the USA, ASML Takes 2nd Spot in Europe, and More News • IH Market News • 06/06/2024 11:34:59 AM
- Form 8-K - Current report • Edgar (US Regulatory) • 05/31/2024 02:44:31 PM
- Form 4 - Statement of changes in beneficial ownership of securities • Edgar (US Regulatory) • 05/29/2024 08:41:58 PM
- Form PX14A6G - Notice of exempt solicitation submitted by non-management • Edgar (US Regulatory) • 05/28/2024 07:21:47 PM
- Form 4 - Statement of changes in beneficial ownership of securities • Edgar (US Regulatory) • 05/28/2024 04:32:46 PM
- Form PX14A6G - Notice of exempt solicitation submitted by non-management • Edgar (US Regulatory) • 05/21/2024 06:54:46 PM
- CalPERS to Oppose Exxon Mobil Directors; Microsoft Unveils Copilot+ PCs with AI Focus, and More News • IH Market News • 05/21/2024 11:18:35 AM
- Form DEFA14A - Additional definitive proxy soliciting materials and Rule 14(a)(12) material • Edgar (US Regulatory) • 05/20/2024 02:50:56 PM
- Form PX14A6G - Notice of exempt solicitation submitted by non-management • Edgar (US Regulatory) • 05/20/2024 01:00:24 PM
- Form DEFA14A - Additional definitive proxy soliciting materials and Rule 14(a)(12) material • Edgar (US Regulatory) • 05/17/2024 03:29:58 PM
- Drill Less, Extract More: This Just Announced Merger Unlocks Profits • AllPennyStocks.com • 05/16/2024 09:12:00 PM
Greenlite Ventures Completes Agreement with No Limit Technology • GRNL • Jul 19, 2024 10:00 AM
VAYK Expects Revenue from First Airbnb Property Starting from August • VAYK • Jul 18, 2024 9:00 AM
North Bay Resources Acquires Mt. Vernon Gold Mine, Sierra County, California, with Assays up to 4.8 oz. Au per Ton • NBRI • Jul 18, 2024 9:00 AM
Nightfood Holdings Signs Letter of Intent for All-Stock Acquisition of CarryOutSupplies.com • NGTF • Jul 17, 2024 1:00 PM
Kona Gold Beverages Reaches Out to Largest Debt Holder for Debt Purchase Negotiation • KGKG • Jul 17, 2024 9:00 AM
Avant Technologies Welcomes Back Former CEO with Eye Toward Future Growth and Expansion • AVAI • Jul 17, 2024 8:00 AM

