


SOURCE:
Private Placement
On August 25, 2022, the Company closed the first tranche of a private placement (the “First Closing”) with several accredited investors (the “Private Placement”). At the First Closing, the Company sold approximately 14.1 million shares of common stock of the Company (collectively, the “Shares”) and warrants to purchase approximately 3.5 million shares of common stock (collectively, the “Warrants”) for an aggregate purchase price of approximately $6.75 million. We received net cash proceeds of approximately $6.3 million, after deducting fees and other estimated offering expenses, from the First Closing.
The closing of the second tranche of the Private Placement (the “Second Closing”) occurred on October 7, 2022. At the Second Closing, the Company sold an additional approximately 6.2 million shares of common stock of the Company and warrants to purchase approximately 1.6 million shares of common stock for an aggregate purchase price of approximately $3.0 million.
The Warrants, described in more detail in Note 10, “Warrants”, have an exercise price of $0.48 per share, are subject to customary anti-dilution, but not price protection, adjustments, are immediately exercisable and expire on the five-year anniversary of the First Closing.
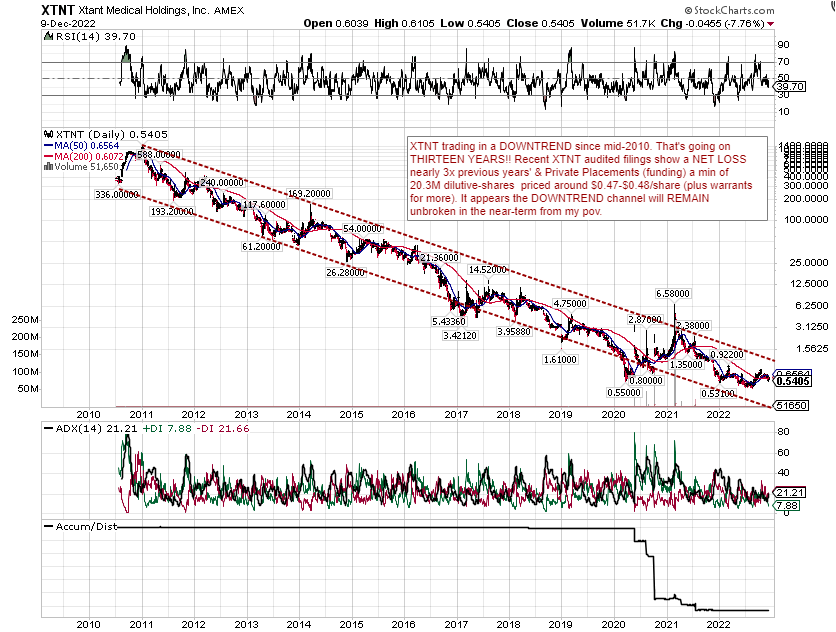
They are STILL LOSING MONEY! Hence the need for funding & the chart shows nearly 13 YEARS of the stock in a DOWNTRENDING CHANNEL. Not sure what others are seeing here ATM but the short-term losses (9 mo period ending from last filing) have ACCELERATED the CASH BURN! And the new funding is BELOW the CURRENT PRICE!! With OVER 20.3M shares (not including any exercised warrants) of overhang bought BELOW the current stock price...
Just started my DD here, as I was PM'd to have a look: But ATM I just don't see it. What am I missing? At least from the charts perspective (& the fundies underscore the sentiment) it appears as though the bottom of the downtrend-channel is going to be tested again soon.
Recent XTNT News
- Xtant Medical Announces Launch of SimpliGraft™ and SimpliMax™ for Chronic and Acute Wounds • GlobeNewswire Inc. • 04/30/2024 09:00:00 AM
- Xtant Medical Announces Record Full Year 2023 Revenue of $91.3 Million • GlobeNewswire Inc. • 04/01/2024 11:00:00 AM
- Xtant Medical to Issue Fourth Quarter and Full Year 2023 Financial Results on April 1, 2024 • GlobeNewswire Inc. • 03/21/2024 08:05:00 PM
- Form 8-K - Current report • Edgar (US Regulatory) • 03/07/2024 10:13:22 PM
- Xtant Medical Increases Revolving Credit Facility to $17 Million with MidCap Financial • GlobeNewswire Inc. • 03/07/2024 09:05:00 PM
- Xtant Medical to Present at the TD Cowen 44th Annual Healthcare Conference • GlobeNewswire Inc. • 02/26/2024 09:05:00 PM
- Form 4/A - Statement of changes in beneficial ownership of securities: [Amend] • Edgar (US Regulatory) • 02/16/2024 09:05:39 PM
- Form SC 13G/A - Statement of acquisition of beneficial ownership by individuals: [Amend] • Edgar (US Regulatory) • 02/13/2024 10:10:19 PM
- Xtant Medical to Participate in Upcoming Investor Conferences • GlobeNewswire Inc. • 02/05/2024 01:00:00 PM
- Form 4 - Statement of changes in beneficial ownership of securities • Edgar (US Regulatory) • 01/18/2024 09:11:41 PM
- Form 4 - Statement of changes in beneficial ownership of securities • Edgar (US Regulatory) • 11/17/2023 09:42:41 PM
- Xtant Medical to Participate in Upcoming Investor Conferences • GlobeNewswire Inc. • 11/09/2023 09:44:21 PM
- Form 8-K - Current report • Edgar (US Regulatory) • 11/09/2023 12:15:30 PM
- Xtant Medical Announces Record Third Quarter Revenue of $25 Million • GlobeNewswire Inc. • 11/09/2023 12:00:00 PM
- Xtant Medical to Issue Third Quarter 2023 Financial Results on November 9, 2023 • GlobeNewswire Inc. • 11/02/2023 08:05:00 PM
- Form 8-K - Current report • Edgar (US Regulatory) • 10/23/2023 09:00:32 PM
- Xtant Medical Announces Acquisition of nanOss Production Operations from RTI Surgical • GlobeNewswire Inc. • 10/23/2023 08:05:00 PM
- Form 4 - Statement of changes in beneficial ownership of securities • Edgar (US Regulatory) • 10/17/2023 08:43:14 PM
- Xtant Medical Highlights Growing Product Portfolio at NASS 2023 • GlobeNewswire Inc. • 10/12/2023 08:05:00 PM
- Form 8-K - Current report • Edgar (US Regulatory) • 08/18/2023 08:15:29 PM
- Form 4 - Statement of changes in beneficial ownership of securities • Edgar (US Regulatory) • 08/17/2023 09:20:50 PM
- Form 4 - Statement of changes in beneficial ownership of securities • Edgar (US Regulatory) • 08/17/2023 09:11:58 PM
- Form 4 - Statement of changes in beneficial ownership of securities • Edgar (US Regulatory) • 08/17/2023 09:01:54 PM
- Form 4 - Statement of changes in beneficial ownership of securities • Edgar (US Regulatory) • 08/17/2023 08:46:52 PM
- Form 4 - Statement of changes in beneficial ownership of securities • Edgar (US Regulatory) • 08/17/2023 08:38:39 PM
NanoViricides Reports that the Phase I NV-387 Clinical Trial is Completed Successfully and Data Lock is Expected Soon • NNVC • May 2, 2024 10:07 AM
ILUS Files Form 10-K and Provides Shareholder Update • ILUS • May 2, 2024 8:52 AM
Avant Technologies Names New CEO Following Acquisition of Healthcare Technology and Data Integration Firm • AVAI • May 2, 2024 8:00 AM
Bantec Engaged in a Letter of Intent to Acquire a Small New Jersey Based Manufacturing Company • BANT • May 1, 2024 10:00 AM
Cannabix Technologies to Deliver Breath Logix Alcohol Screening Device to Australia • BLO • Apr 30, 2024 8:53 AM
Hydromer, Inc. Reports Preliminary Unaudited Financial Results for First Quarter 2024 • HYDI • Apr 29, 2024 9:10 AM

