


| Followers | 679 |
| Posts | 140877 |
| Boards Moderated | 36 |
| Alias Born | 03/10/2004 |
Monday, November 28, 2022 1:13:46 PM
By: Mike Zaccardi | November 28, 2022
• Energy stocks outpace the broad equity market
• Crude oil has fallen to its lowest price since January, now down year-on-year
• Possible long-term support on the chart, potential bullish fundamental catalysts
It has been a banner year for energy. The Energy Select Sector SPDR (XLE) is higher by 66% so far in 2022 while two other, more niche, funds are positive by handsome amounts, as well. The SPDR S&P Oil & Gas Exploration & Production ETF (XOP) has returned 50%, including dividends, while the VanEck Oil Services ETF (OIH) sports a 57% advance.
Not surprisingly, the recent plunge in oil prices has resulted in more sanguine inflation outlooks among traders.
Energy Equities Continue to Work Despite Lower Oil
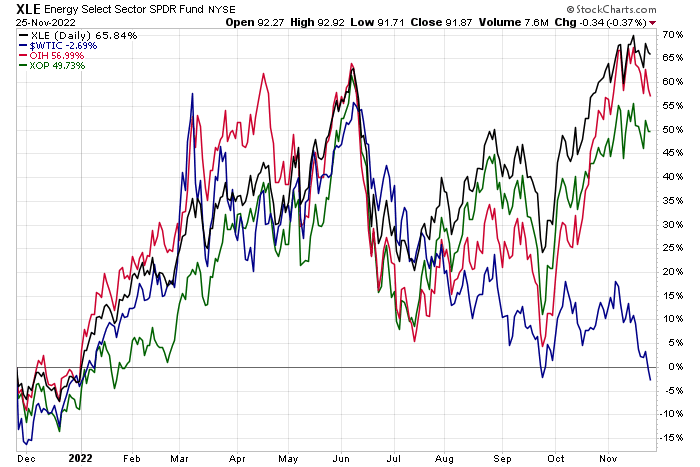
XLE Daily
Source: StockCharts.com
As of the close last Wednesday, both the 5-year forward breakeven inflation rate and the “5y5y” which measures expected inflation over the five-to-10-year horizon stood just above 2.3%—near the lowest figures in the last year. The rosier outlook for consumer prices comes after October’s better-than-expected CPI report that sent stocks soaring. But a new factor now comes into play that could keep a lid on rising costs across the economy and the world.
Inflation Expectations Cooling: Near 2.3% Next 10 Years
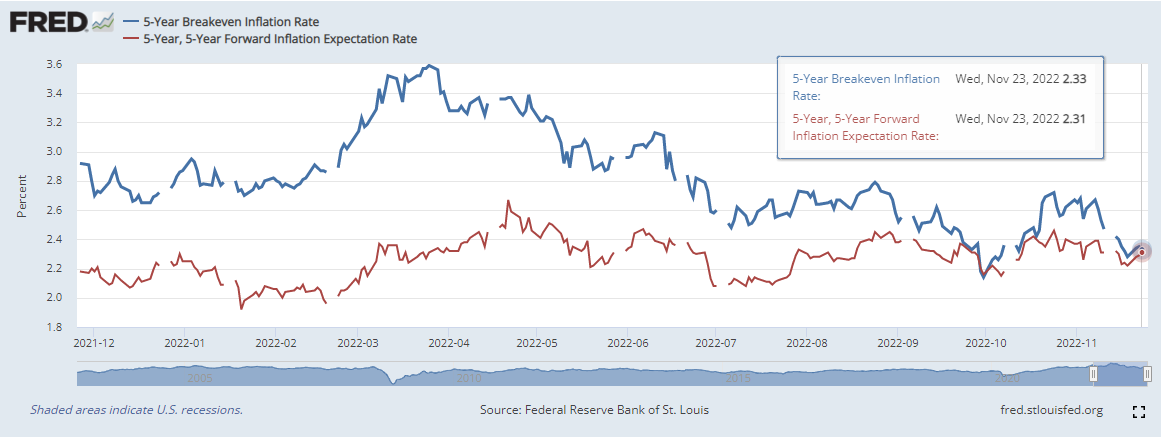
5-Year Breakeven Inflation Rates
Source: St. Louis Federal Reserve
West Texas Intermediate crude oil ended last week at its lowest closing price since Jan. 3. Likewise, wholesale gasoline futures settled at the lowest weekly level dating back to the first month of 2022. Oil is now modestly negative from a year ago even with four-decade-high inflation rates and ongoing turmoil following Russia’s invasion of Ukraine.
Oil Futures: Down 3% Year-on-Year
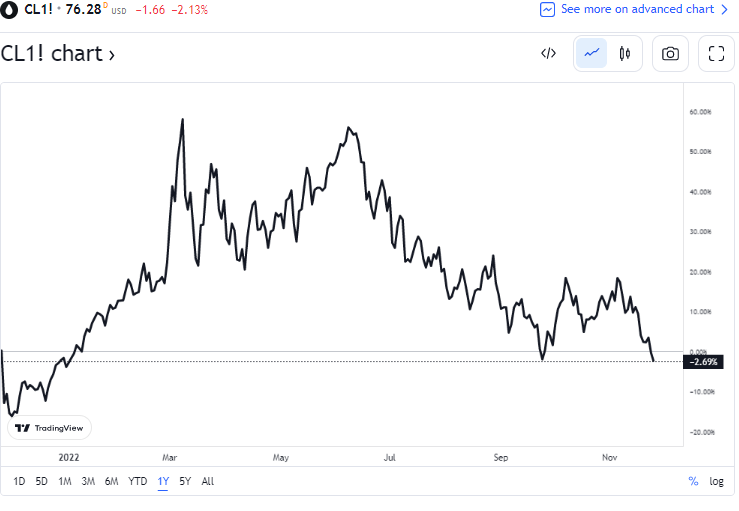
Oil Futures
Source: TradingView
Let’s home in on where oil might go from here. Is there much more room to the downside? If so, where’s a good spot to start nibbling long again?
I see important support in the $62 to $66 range. Notice in the chart that WTI has significant volume by price in that zone. That is also where the top end of WTI’s 2019 through early 2020 range highs were seen. Finally, there were a pair of pullbacks to the low $60s last year—the presumption is that that area attracted buyers then, and it will do so once more.
Eyeing WTI Support in the Low to Mid-$60s
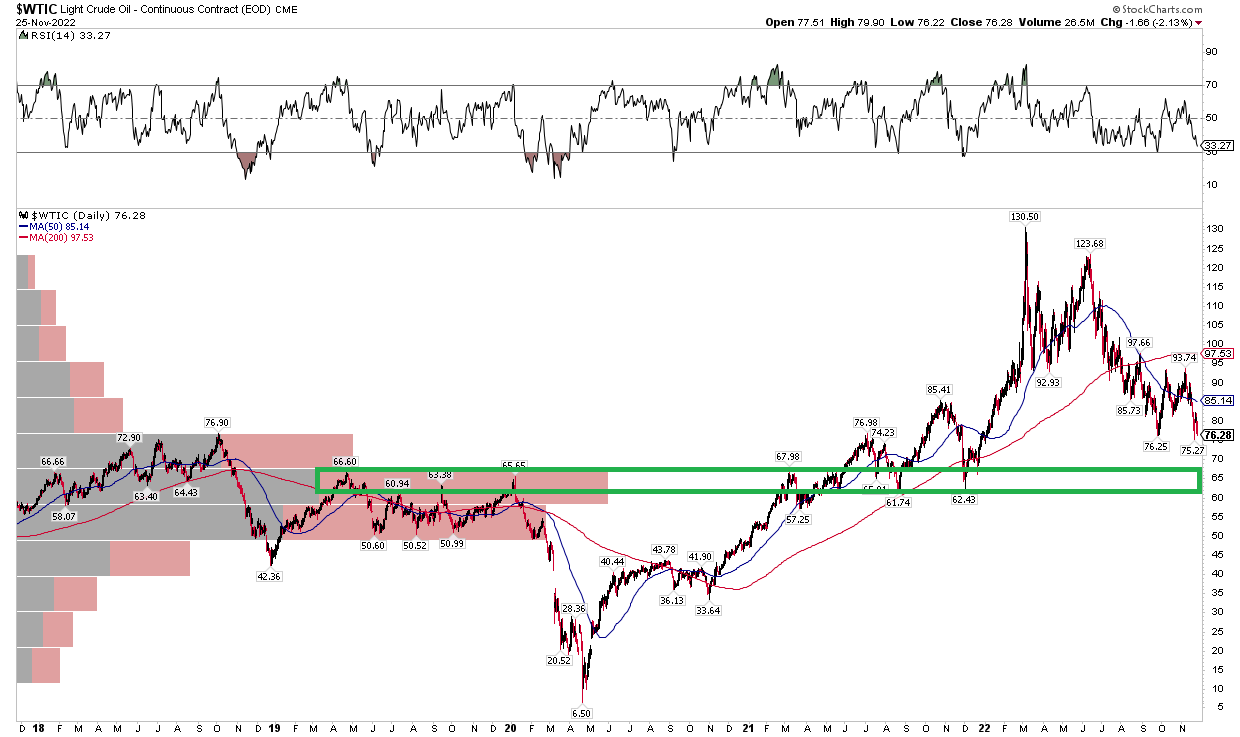
WTI Daily
Source: StockCharts.com
The bearish technical case for oil is that its long-term 200-day moving average is now rolling over and the shorter-term 50-day moving average is decidedly negatively sloped. After failing to notch a new high back in the second quarter, momentum has been on the side of the bears. A failure at climbing above the mid-$90s is another pain point. If we see a bounce in the low to mid-$60s, expect some resistance near $76.
Fundamental support could come from a reopening in China or even the U.S. administration seeking to take advantage of lower prices by refilling the Strategic Petroleum Reserve which is the most depleted since March of 1984.
Bullish Catalyst: Refilling the SPR
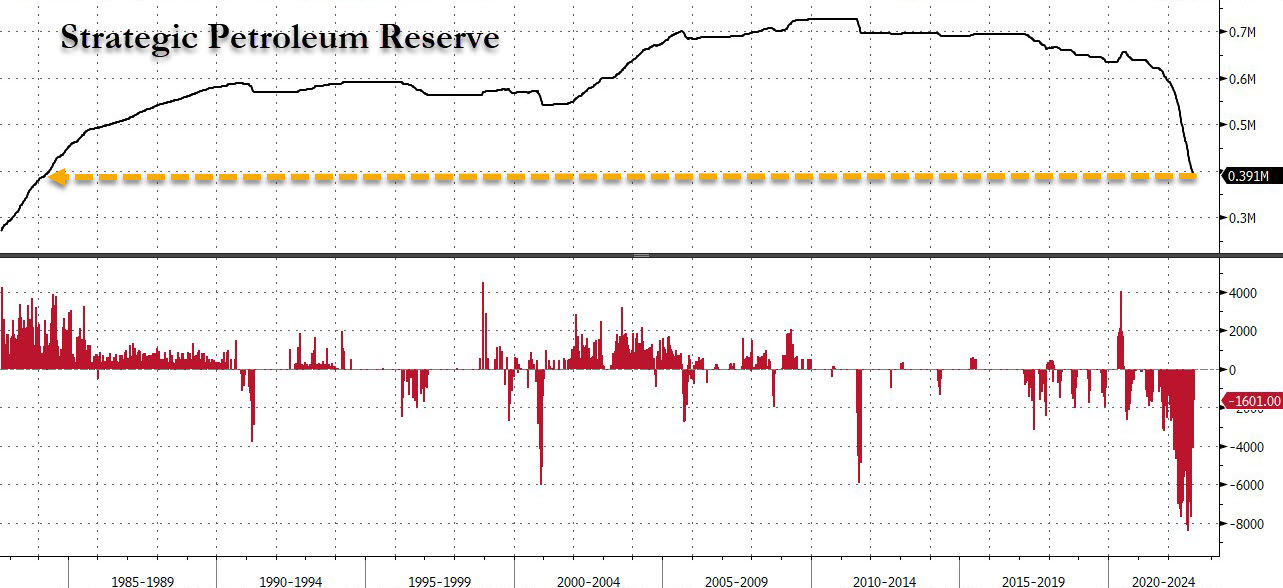
SPR Levels
Source: ZeroHedge, Bloomberg
The Bottom Line
I see further downside ahead for WTI oil prices. The key commodity settled at a fresh weekly closing price dating back to January on Black Friday and is now negative on an annual basis. Look for support in the low to mid-$60s.
Read Full Story »»»
 DiscoverGold
Information posted to this board is not meant to suggest any specific action, but to point out the technical signs that can help our readers make their own specific decisions. Caveat emptor!
• DiscoverGold
Bantec Reports an Over 50 Percent Increase in Sales and Profits in Q1 2024 from Q1 2023 • BANT • Apr 25, 2024 10:00 AM
Cannabix's Breath Logix Alcohol Device Delivers Positive Impact to Private Monitoring Agency in Montana, USA • BLO • Apr 25, 2024 8:52 AM
Kona Gold Beverages, Inc. Announces Name Change to NuVibe, Inc. and Initiation of Ticker Symbol Application Process • KGKG • Apr 25, 2024 8:30 AM
Axis Technologies Group and Carbonis Forge Ahead with New Digital Carbon Credit Technology • AXTG • Apr 24, 2024 3:00 AM
North Bay Resources Announces Successful Equipment Test at Bishop Gold Mill, Inyo County, California • NBRI • Apr 23, 2024 9:41 AM
Epazz, Inc.: CryObo, Inc. solar Bitcoin operations will issue tokens • EPAZ • Apr 23, 2024 9:20 AM

