


| Followers | 686 |
| Posts | 142970 |
| Boards Moderated | 35 |
| Alias Born | 03/10/2004 |
Tuesday, November 15, 2022 9:42:17 AM
By: Cheddar Flow | November 15, 2022
Nvidia Earnings Preview
Nvidia has a 1.1% weighting and is ranked #12 in the S&P 500 index. The outcome of Nvidia earnings has the potential to help drive the index higher or lower. Nvidia reports earnings after the close on Wednesday, November 16th. The street is expecting results of 0.71 EPS on $5.8B of revenue. This would imply an earnings contraction of 39% on EPS and 18% in revenue growth YoY.
The negative sentiment built into Nvidia earnings has the impact to cause an increase in share price if better than feared numbers are reported. Currently, since October 17th, Nvidia’s share price is up 40% on the month or $45. Using dark pool data, order flow, technical analysis, and fundamental analysis before an earnings release will give us the most optimal and informed trading strategy to use for the event.
Nvidia Fundamental Analysis
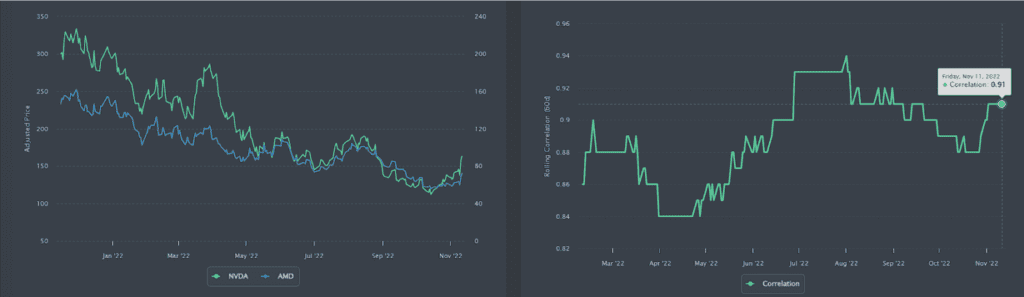
It is notable to mention why the 31 analysts who cover NVDA earnings have all given revisions and slower growth expectations throughout the quarter. In part, this is due to the recent $AMD earnings release which missed on both revenue and EPS on November 1st. The larger reason is due to the U.S. ban on the A100 and H100 semiconductor exports to China. In the recent fall product launch, Nvidia claims it will only impact $400m in sales for its current quarter. They also state they have a workaround for the U.S. export ban, with its A800 chip.
As shown in the chart below, AMD and NVDA are highly correlated stocks. The implied earnings move of AMD was 7.85% and the stock realized a -1.73% the next day, which allowed for a great earnings trade. So, now that the market has had exposure to AMD’s earnings will Nvidia earnings revisions be priced in?
Metrics and Analysis for Nvidia Earnings
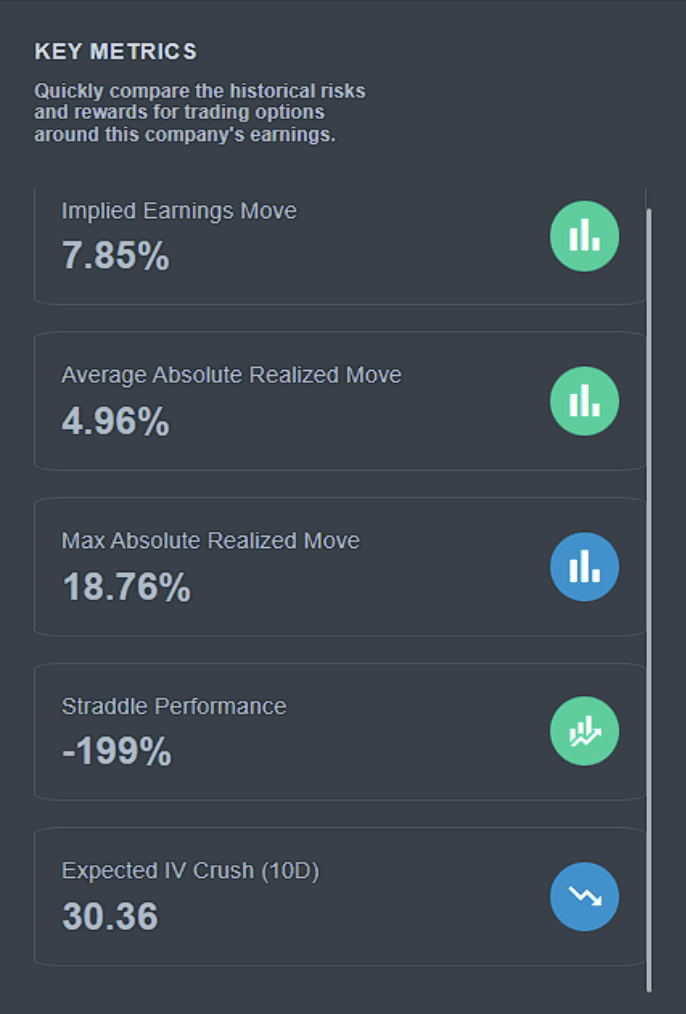
The options market is implying a 7.85% move post-earnings announcement. The average realized move is 4.96% and the maximum realized move was 18.76%. Currently, there is a 2.89% higher earnings implied move than the average realized move. This means that there is a 37% theoretical edge by selling volatility through the event.
As shown in the straddle performance in the chart below, on average, buying a straddle before the announcement and selling the day after would have lost -199% of your initial investment over the last 4 years of earnings. That also means that selling a straddle before earnings would have made you 199% on average if you did so in every earnings announcement over the last 4 years.
Earnings Trade Strategy For Nvidia
Depending on your risk tolerance and the expected outcome of the trade, there are a couple of methods you can use here. The first would be an Iron Condor which is a risk-defined, directionally neutral strategy. The goal is to collect a premium upon entering the trade while believing that Nvidia will not move past the 7.85% implied move.
The other strategy to use would be a calendar spread which is also a risk-defined, directionally neutral strategy. The trade is entered with a net debit but carries a higher payout than the iron condor strategy. We will analyze each method below. As always, options are risky and you can lose 100% of your initial investment.
Nvidia Earnings Backtested
The data and charts presented are from the last 4 years of Nvidia earnings results. As you can see in the “moves” chart, which shows the earnings implied move over the last 4 years, we are at the higher end of the implied moves.
Also in the same picture, you can see that straddles consistently lose money. More notably, Nvidia is reporting Q3 earnings, in which the highest ever realized move during Q3 earnings results was 7.25%. Already the options market is overpricing Nvidia’s implied move...
* * *
Read Full Story »»»
 DiscoverGold
Information posted to this board is not meant to suggest any specific action, but to point out the technical signs that can help our readers make their own specific decisions. Caveat emptor!
• DiscoverGold
Recent NVDA News
- Form 144 - Report of proposed sale of securities • Edgar (US Regulatory) • 07/26/2024 08:34:27 PM
- Alphabet Unveils AlphaProof and AlphaGeometry 2; OpenAI Tests SearchGPT; Apple Loses Market Share in China • IH Market News • 07/26/2024 10:07:41 AM
- Form 4 - Statement of changes in beneficial ownership of securities • Edgar (US Regulatory) • 07/25/2024 09:09:10 PM
- Form 144 - Report of proposed sale of securities • Edgar (US Regulatory) • 07/25/2024 08:21:03 PM
- Form 144 - Report of proposed sale of securities • Edgar (US Regulatory) • 07/24/2024 08:28:45 PM
- Meta Unveils Llama 3 AI Model, Elon Musk’s X Poll Backs Tesla’s $5B xAI Investment, and More • IH Market News • 07/24/2024 09:53:32 AM
- Form 4 - Statement of changes in beneficial ownership of securities • Edgar (US Regulatory) • 07/23/2024 08:54:36 PM
- Form 144 - Report of proposed sale of securities • Edgar (US Regulatory) • 07/23/2024 08:30:23 PM
- NVIDIA AI Foundry Builds Custom Llama 3.1 Generative AI Models for the World’s Enterprises • GlobeNewswire Inc. • 07/23/2024 03:15:00 PM
- Futures Pointing To Modestly Lower Open On Wall Street • IH Market News • 07/23/2024 01:08:59 PM
- U.S. Index Futures Dip Slightly as Investors Await Major Earnings Reports, Oil Prices Edge Up • IH Market News • 07/23/2024 10:04:07 AM
- Form 144 - Report of proposed sale of securities • Edgar (US Regulatory) • 07/22/2024 08:37:46 PM
- Nvidia Helps Lead Tech Rebound On Wall Street • IH Market News • 07/22/2024 08:36:18 PM
- Berkshire Sells BofA Holdings, Ryanair Shares Drop 12%, Delta Still Struggling After IT Disruption • IH Market News • 07/22/2024 09:44:17 AM
- Form 144 - Report of proposed sale of securities • Edgar (US Regulatory) • 07/19/2024 09:28:45 PM
- Form 4 - Statement of changes in beneficial ownership of securities • Edgar (US Regulatory) • 07/19/2024 08:33:06 PM
- Form 4 - Statement of changes in beneficial ownership of securities • Edgar (US Regulatory) • 07/18/2024 09:20:02 PM
- Form 3 - Initial statement of beneficial ownership of securities • Edgar (US Regulatory) • 07/18/2024 09:17:13 PM
- Form SC 13G - Statement of Beneficial Ownership by Certain Investors • Edgar (US Regulatory) • 07/18/2024 09:15:26 PM
- Form 144 - Report of proposed sale of securities • Edgar (US Regulatory) • 07/18/2024 08:21:46 PM
- Nasdaq Tech Stocks Show Partial Recovery; Oil Prices Rise • IH Market News • 07/18/2024 10:01:11 AM
- Darden Acquires Chuy’s for $605M, BYND Drops 14% Amid Debt Restructuring, Petco Appoints Ex-Five Below CEO • IH Market News • 07/18/2024 09:59:44 AM
- Form 4 - Statement of changes in beneficial ownership of securities • Edgar (US Regulatory) • 07/17/2024 08:59:50 PM
- U.S. Stocks Close On Mixed Note; Dow Rises To New High, Nasdaq Tumbles • IH Market News • 07/17/2024 08:41:00 PM
- Form 144 - Report of proposed sale of securities • Edgar (US Regulatory) • 07/17/2024 08:33:45 PM
Glidelogic Corp. Announces Revolutionary AI-Generated Content Copyright Protection Solution • GDLG • Jul 26, 2024 12:30 PM
Southern Silver Files NI43-101 Technical Report for its Updated Preliminary Economic Assessment for the Cerro Las Minitas Project • SSV • Jul 25, 2024 8:00 AM
Greenlite Ventures Completes Agreement with No Limit Technology • GRNL • Jul 19, 2024 10:00 AM
VAYK Expects Revenue from First Airbnb Property Starting from August • VAYK • Jul 18, 2024 9:00 AM
North Bay Resources Acquires Mt. Vernon Gold Mine, Sierra County, California, with Assays up to 4.8 oz. Au per Ton • NBRI • Jul 18, 2024 9:00 AM
Nightfood Holdings Signs Letter of Intent for All-Stock Acquisition of CarryOutSupplies.com • NGTF • Jul 17, 2024 1:00 PM

