NYSE and SPX New Lows Confirm Price Bottom By: Erin Swenlin | September 28, 2022
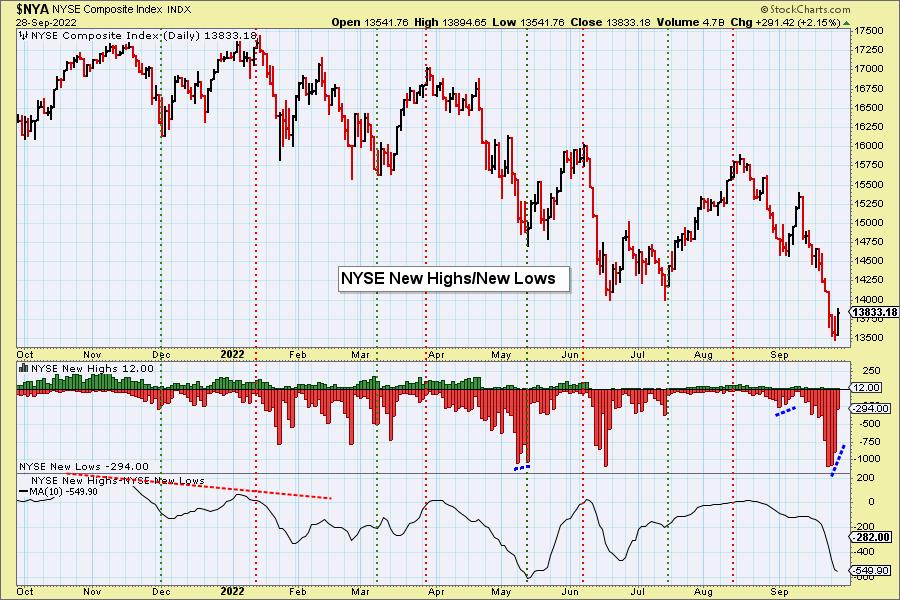
As we saw a positive divergence materialize on the $SPX with New Lows, we thought it a good time to bring out the NYSE New Highs/New Lows chart. It also has a positive divergence between shrinking New Lows and price bottoms that were moving lower. This indicator has been very successful finding market bottoms. Based on the chart below they can come before a long rally or a very short one.
When we expand the timeframe to include the bear market of 2020, you can see that a positive divergence on New Lows arrived at the bear market bottom.
Conclusion: While we aren't calling this the end of the bear market (definitely not), the current positive divergence is very encouraging as we finish a strong rally day.
Information posted to this board is not meant to suggest any specific action, but to point out the technical signs that can help our readers make their own specific decisions. Caveat emptor! • DiscoverGold
Register for free to join our community of investors and share your ideas. You will also get access to streaming quotes, interactive charts, trades, portfolio, live options flow and more tools.


 News
News  Market Data
  Discover